Getting Started
Logging In
URL for Activated Users
To log into your account, go to https://app.inzwa.cloud/login
Logging In as a First Time User
In order to log into Inzwa Cloud, a user account must be created first. If you haven't received an activation email, please contact your system administrator or Inzwa for access.
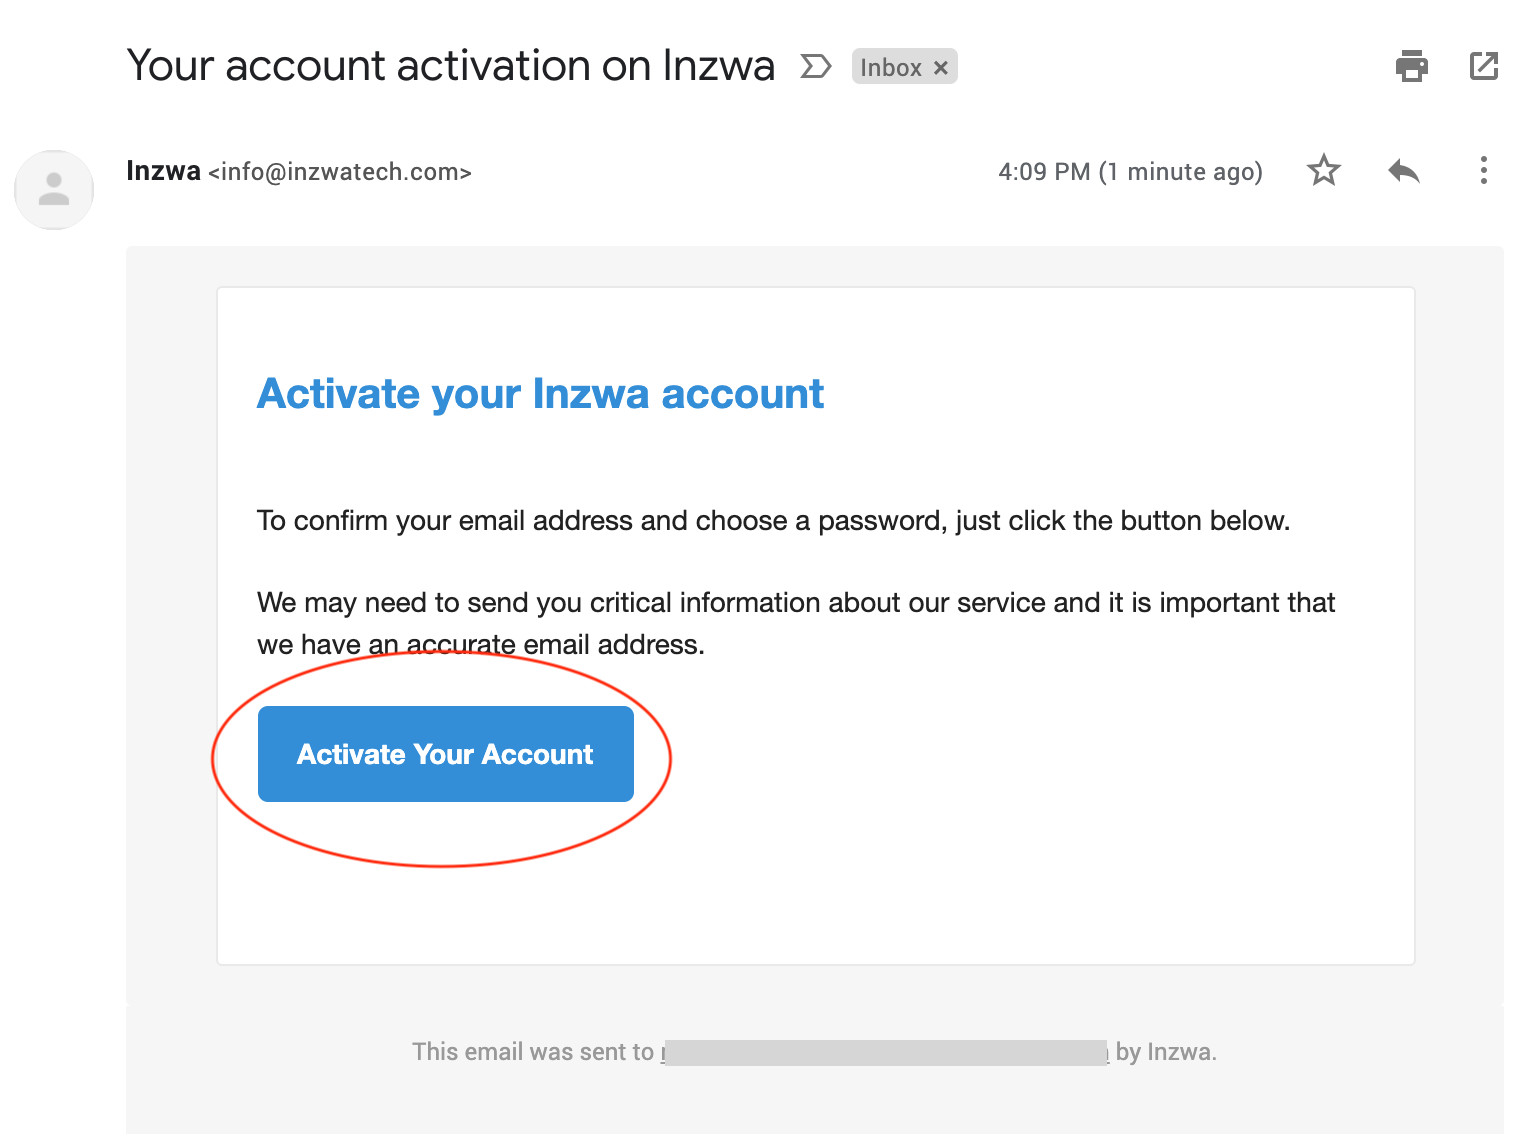
Your account activation email will be similar to the following:
-
Click on the activation button in the email message.
-
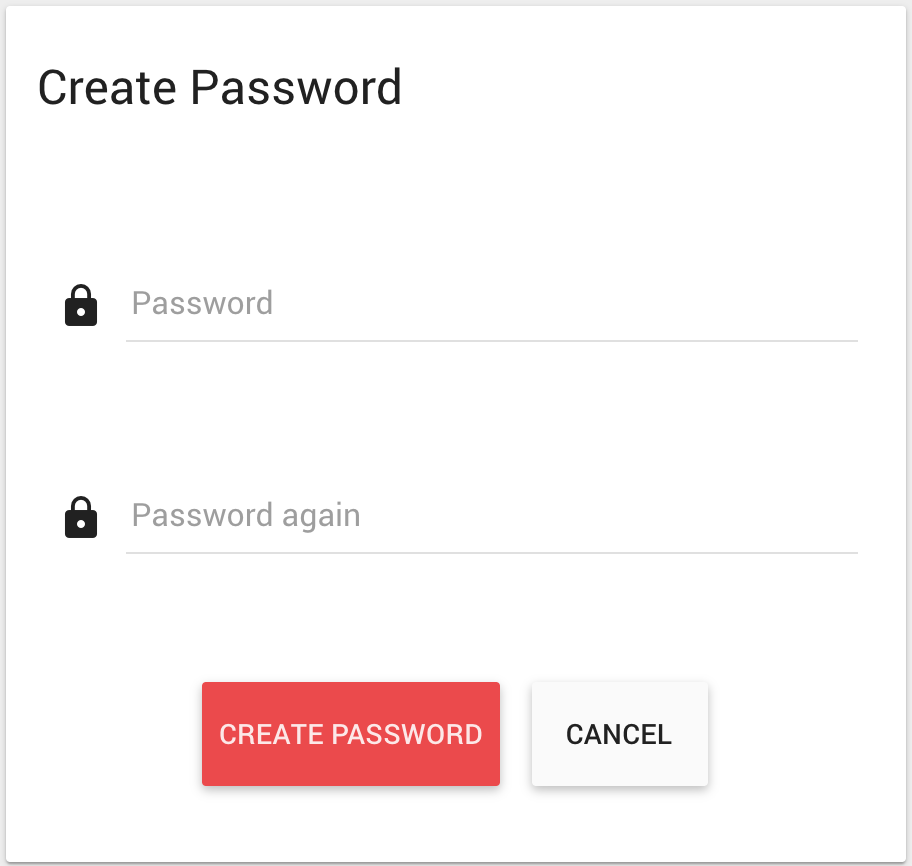
Create a password for your account.
-
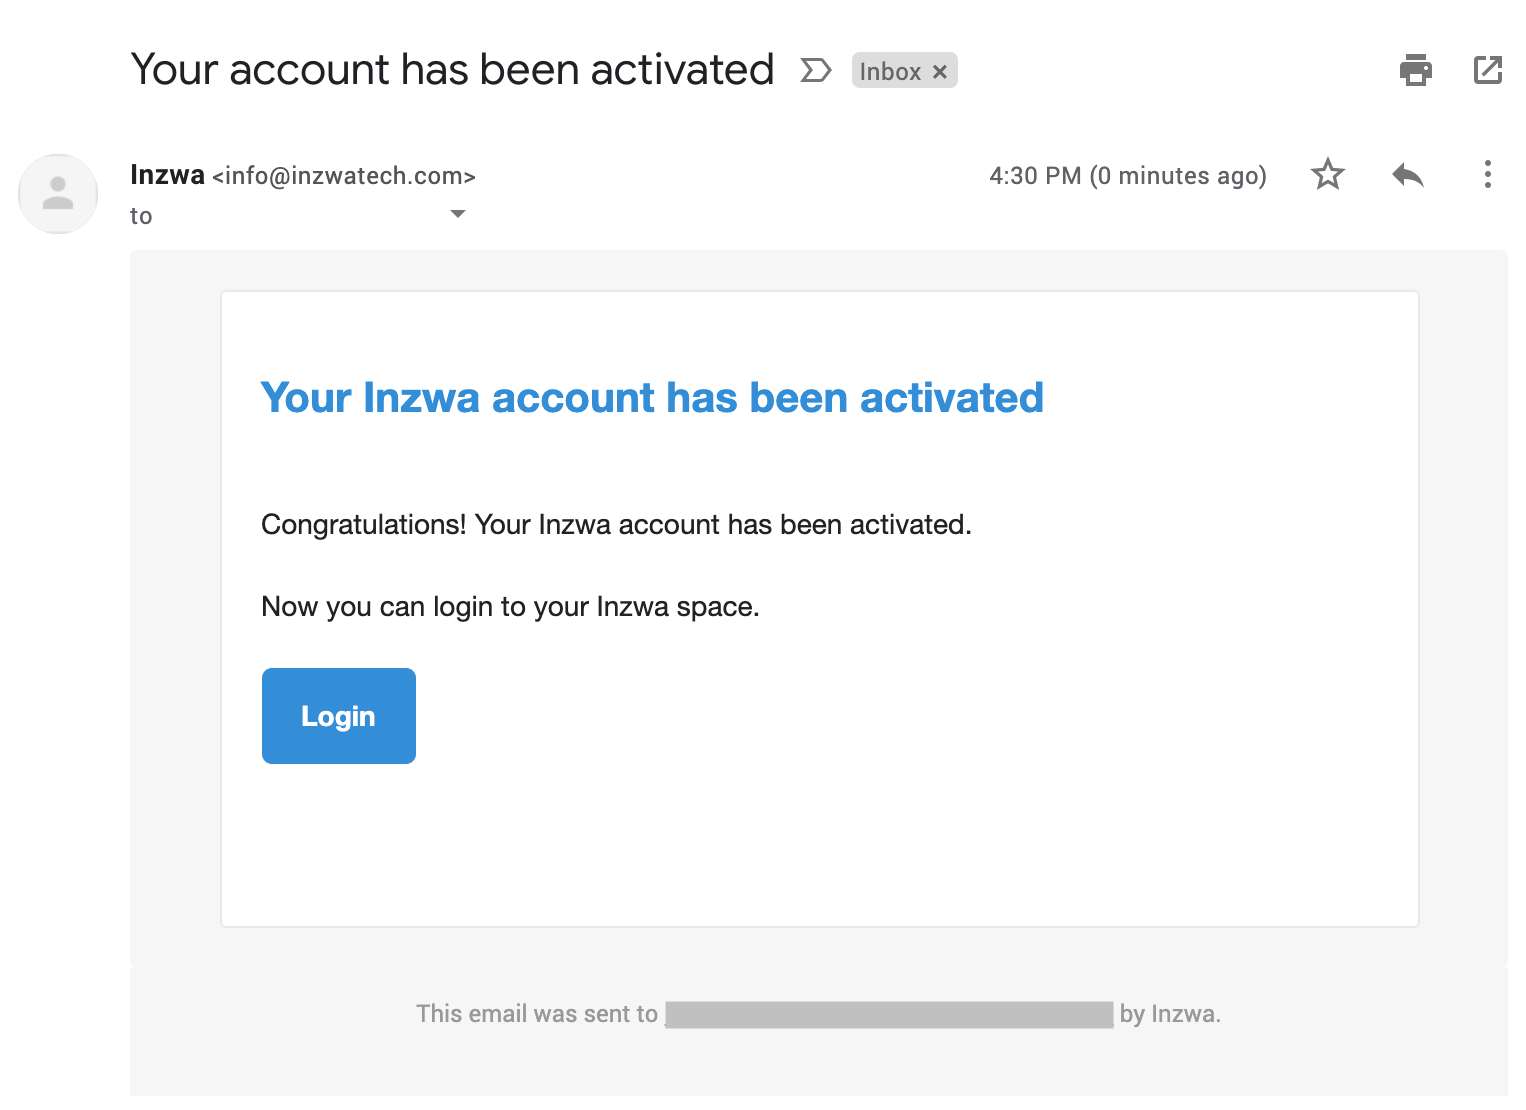
Once you've created your password, you'll be logged in and presented with with main dashboard. You will also receive a confirmation email.
Navigation Basics
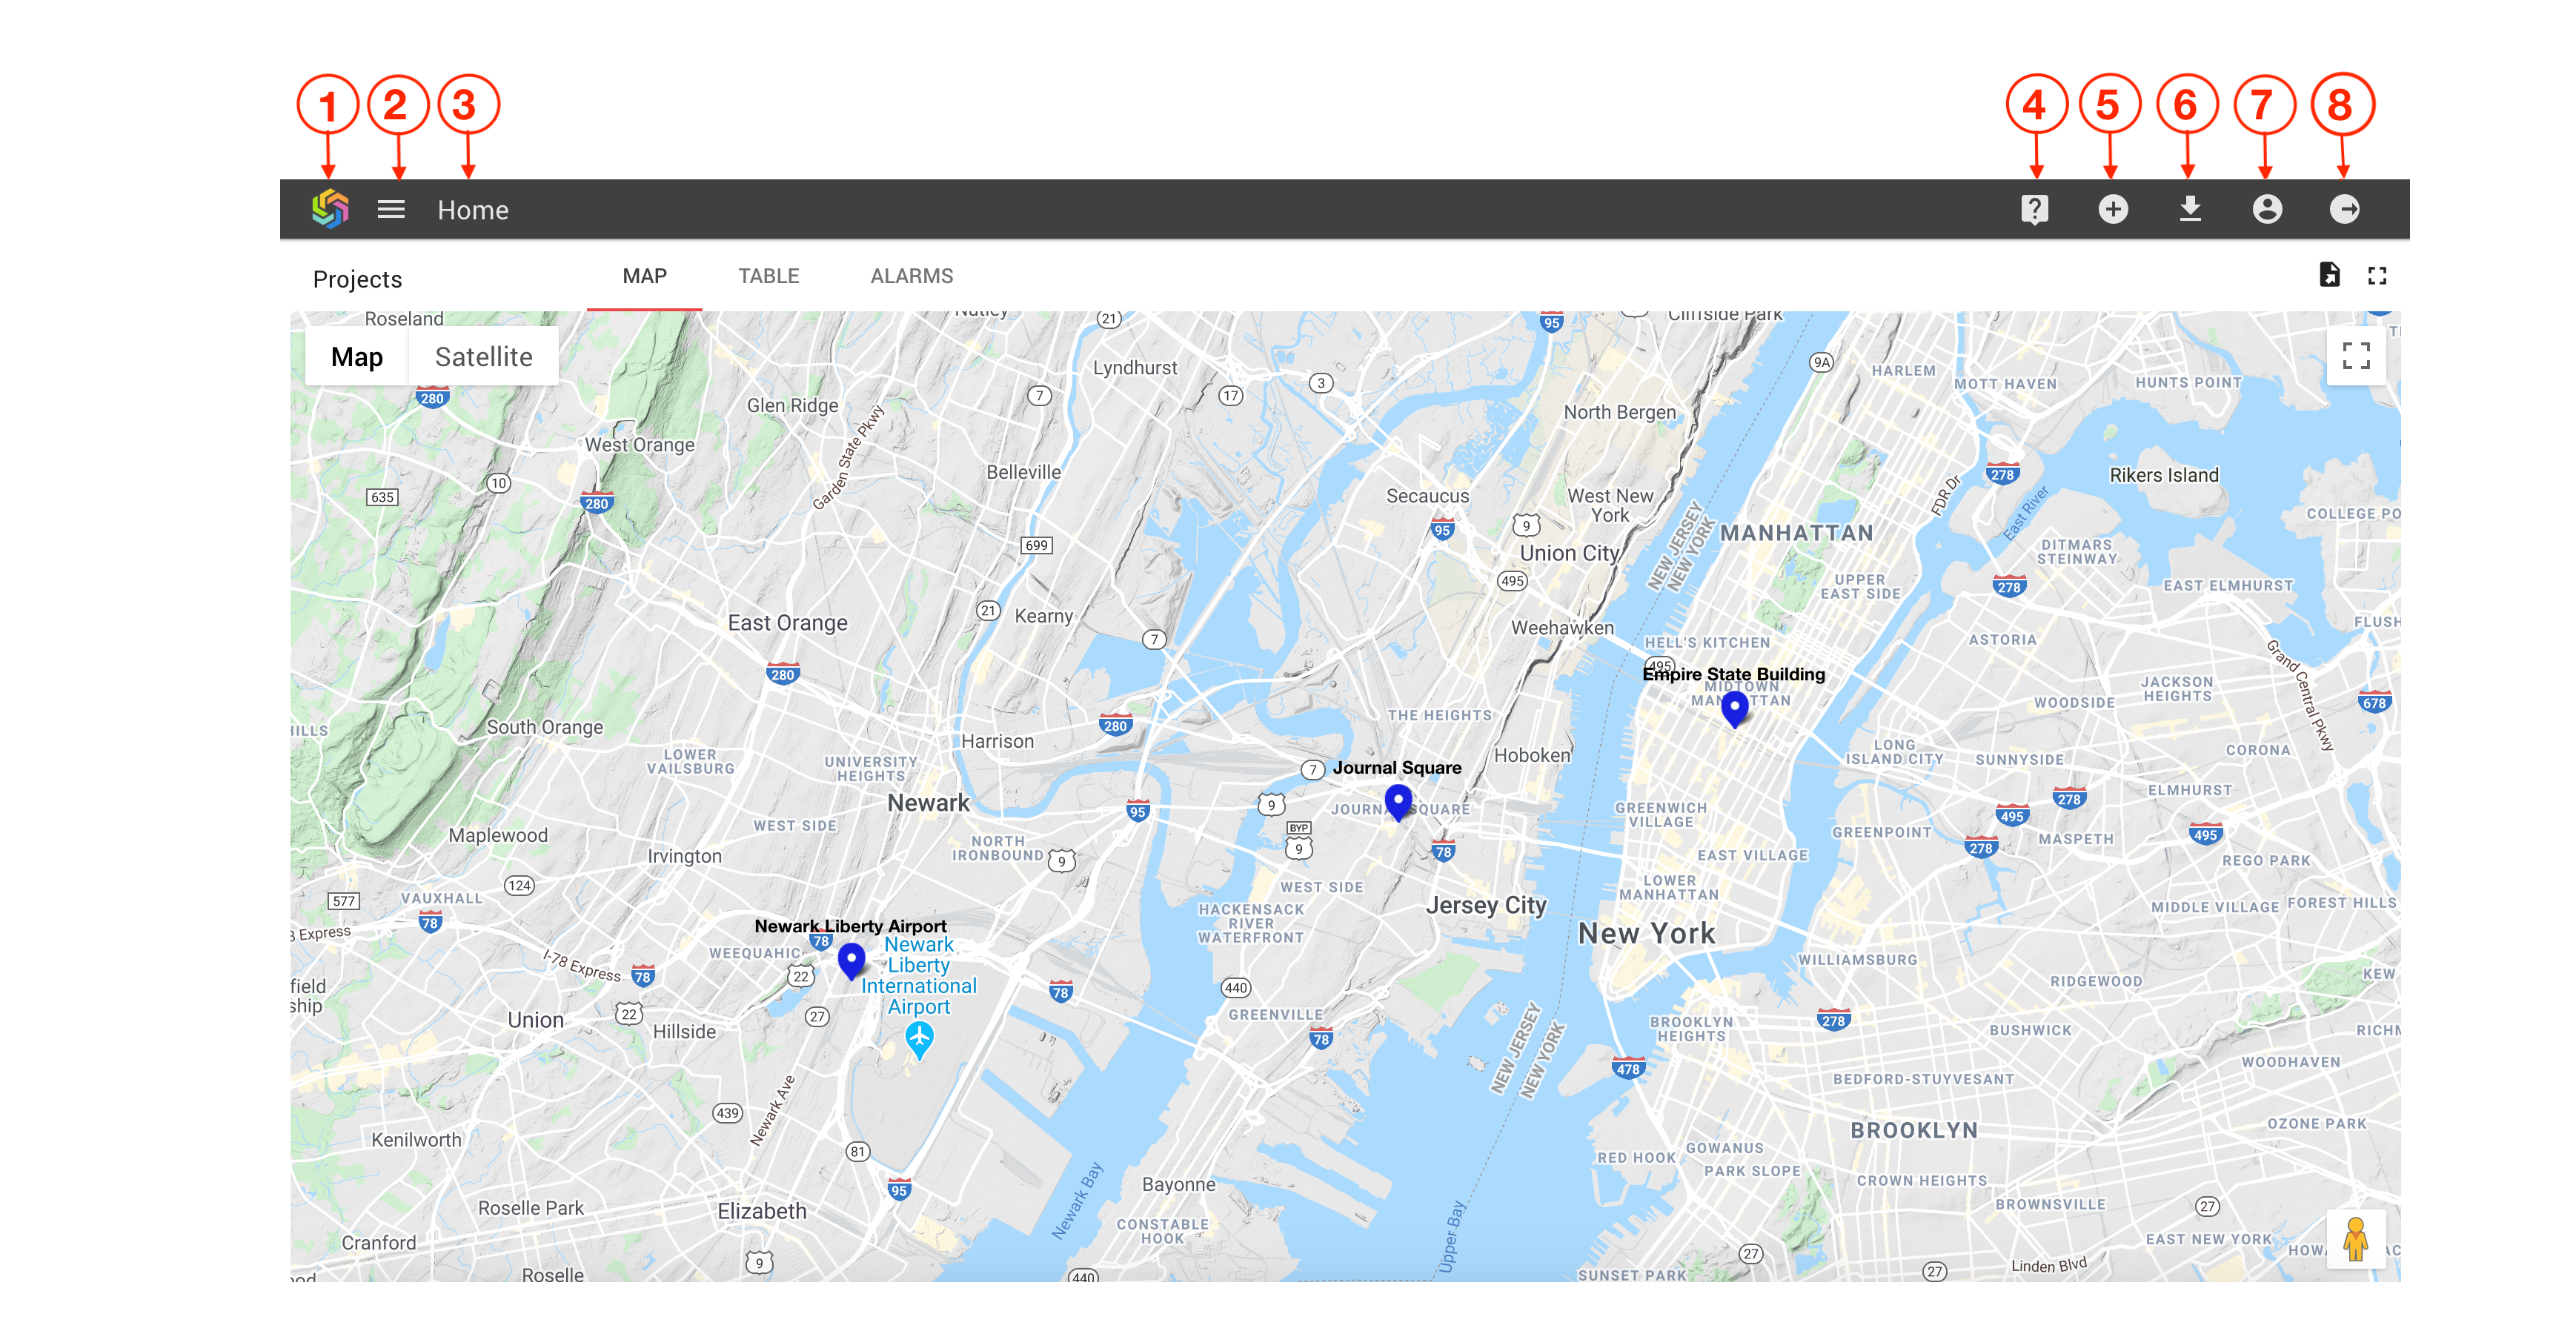
Once logged into Inzwa Cloud, you'll be presented with the Home Screen, which will look similar to this image. The Home screen displays all of the active projects in your system on a single map.
- Home Button (All users) - The Inzwa logo serves as a home button which returns you to the Home screen, which is the top level of the system.
- Configuration Menu (Tenant users) - Tenant users have the ability to configure projects, users, devices, etc. in Inzwa Cloud using this menu. Customer users will not have this navigation bar item.
- Screen Name (All users) - The name of the screen displayed is shown. Typically, you'll see Home, Project, Device appear here.
- Live Help (Tenant users) - During normal business hours, click to hold a live chat with a member of our support team. After hours, click to send a message to our support team and they'll get back to you the next business day. Customer users will not have this navigation bar item.
- Wizards (Tenant users) - Inzwa Cloud has configuration wizards which make it easy for Tenant users to do most of the common tasks in a few clicks. Customer users will not have this navigation bar item.
- Export/Share Dashboard (All users) - Inzwa Cloud allows you to export the current view from any screen in the system. A screen shot can be downloaded in PDF, PNG, or JPEG format. In addition, you can share the current view with users or distribution group.
- Profile (All users) - Manage your profile information, including changing your password.
- Logout (All users) - Click to logout of your current user session.
Home Screen
Sub-navigation Features
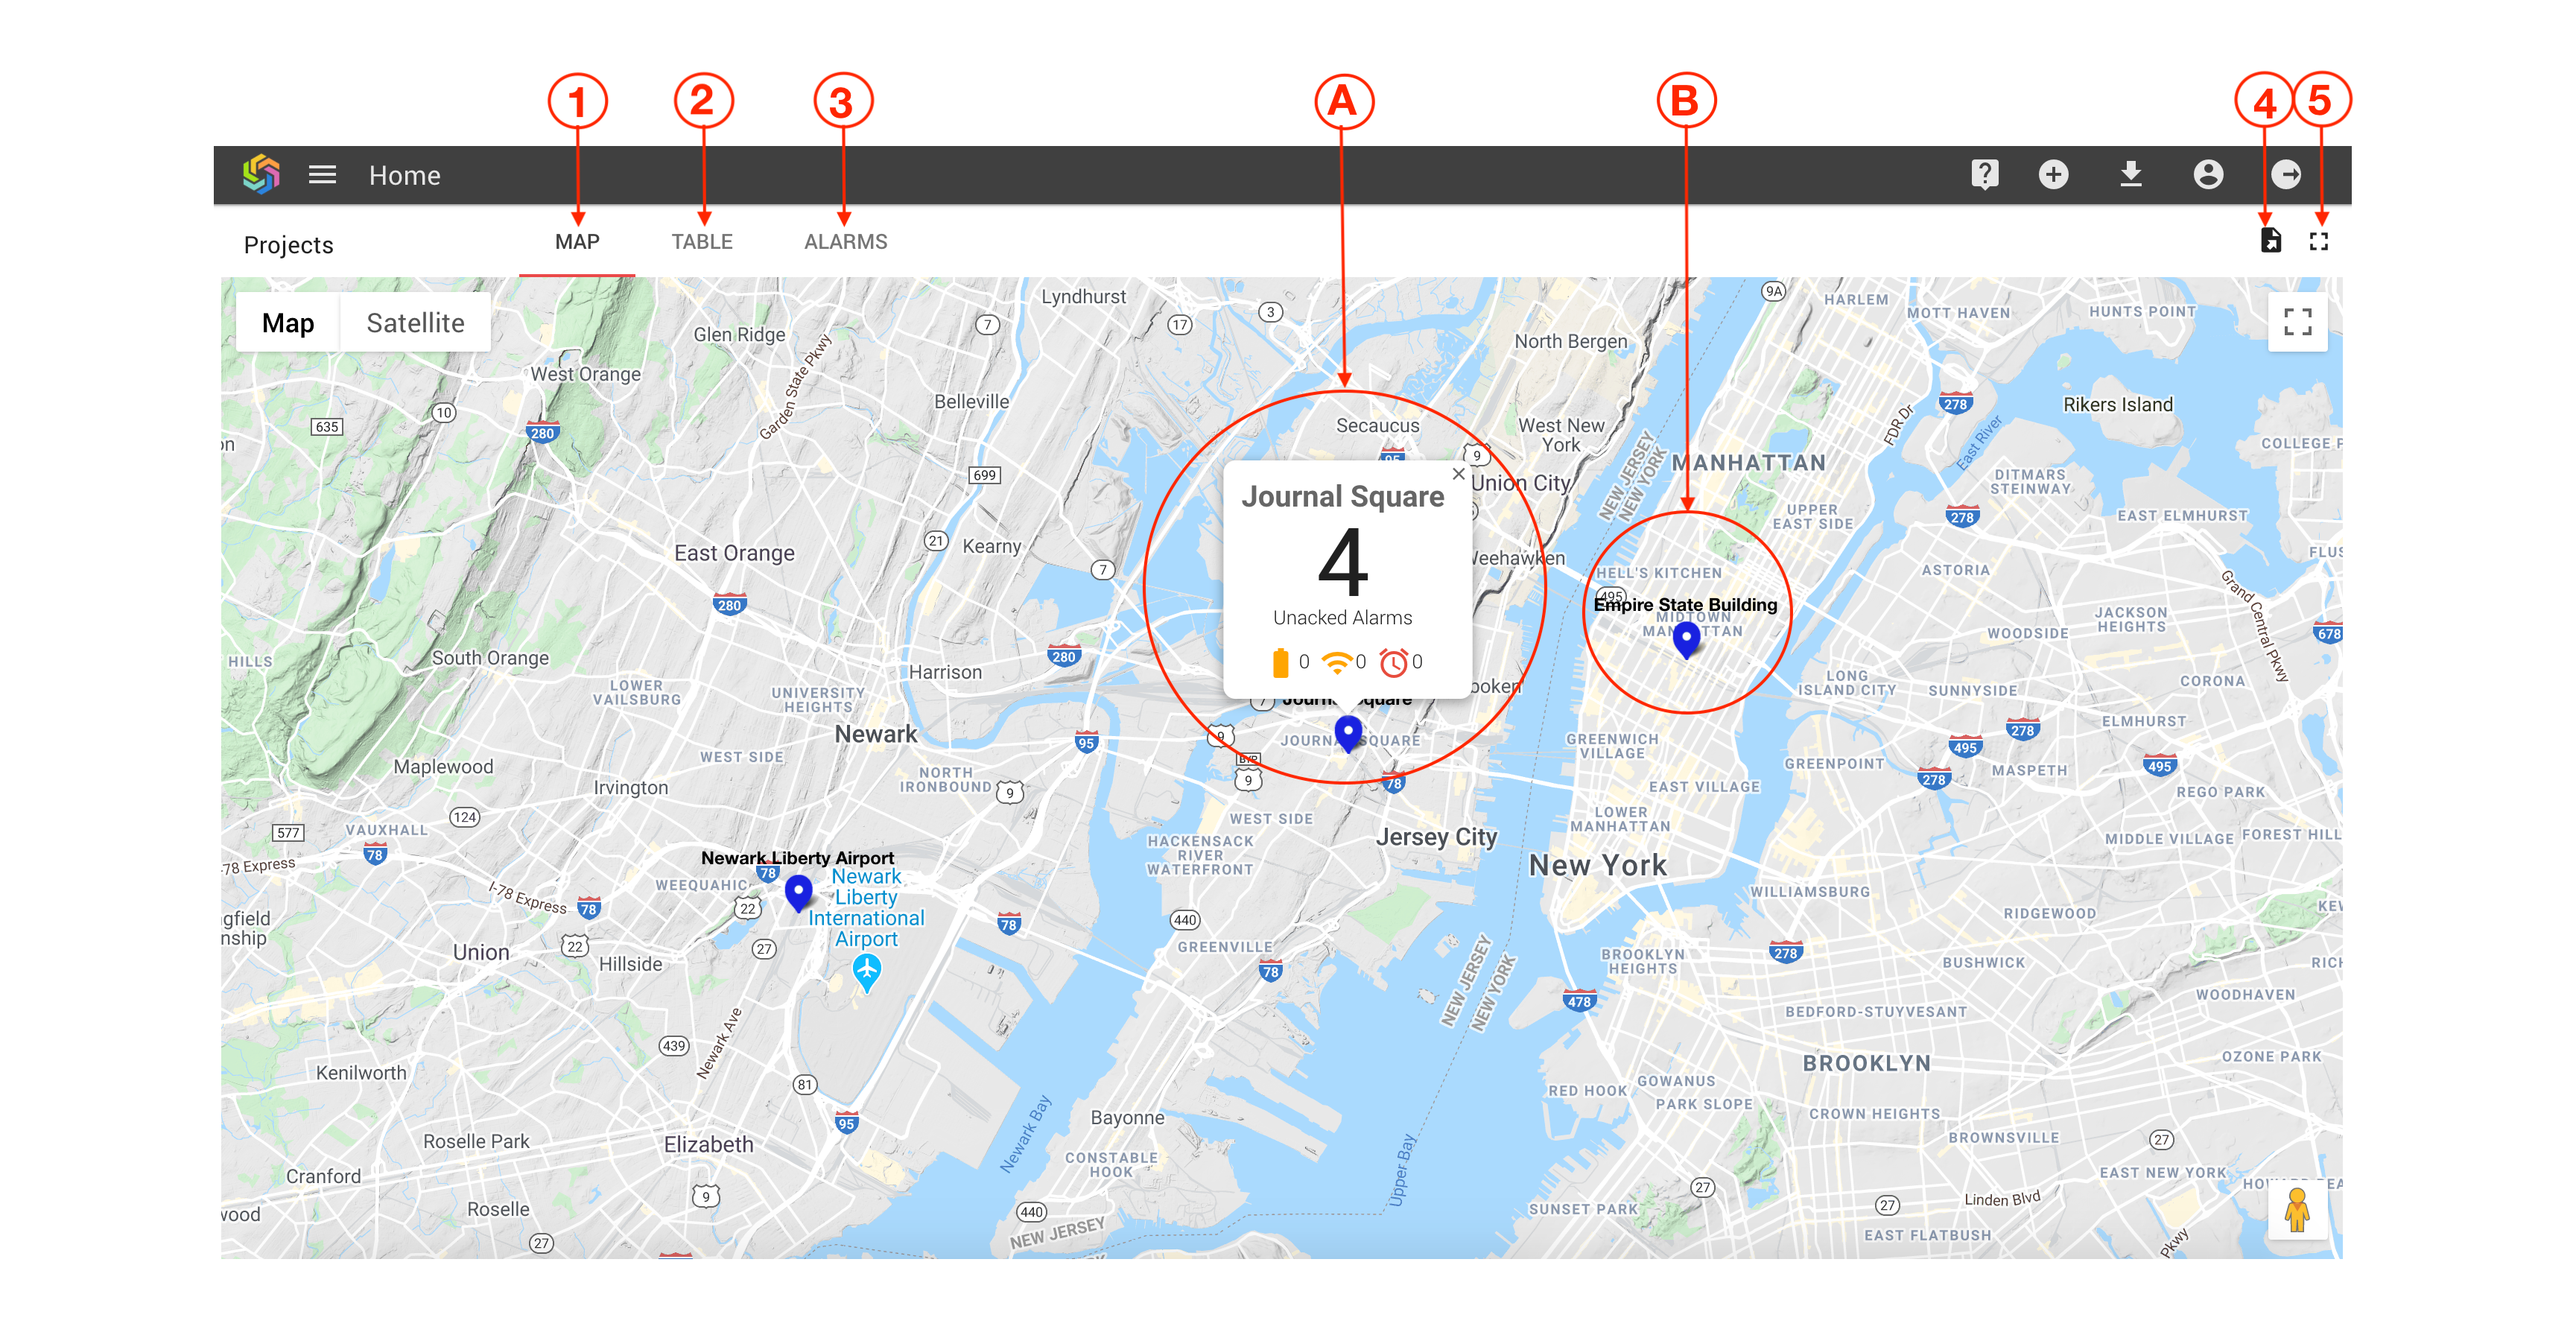
The Home Screen also has a sub-navigation bar with these features:
- Map View (All users) - If at least one project is configured with an address or latitude/longitude coordinates, the map view will appear on the home screen and will be the default view.
- Table View (All users) - All active projects appear in a table view. This will be the default view if no projects have address or latitude/longitude coordinates.
- Alarms View (All users) - All recent alarm activity for all projects is shown in the alarm view.
- Export Data (All users) - Export data about the projects displayed on the Home Screen.
- Full Screen (All users) - Click to display in full screen mode.
Map View Features
The map view can display detailed information about specific projects.
By clicking on a project's pin, you can view a tooltip displaying details about the project. By default, each project is displayed on the map with a colored pin and the project's name. Clicking the name will open the tool tip.
In the map view, each project is marked with a colored pin that designates the current status of that project. The meaning of each color is described in the following table. When a project has more than one status active, Inzwa Cloud will display the highest level of severity.
| Marker | Status Description |
|---|---|
| Project has active alarms. | |
 | The project has devices with low battery or signal strength. |
 | The project has unacknowledged alarms. |
| Nothing requiring attention on this project. |
The project tool tip displays detailed status information about the project.
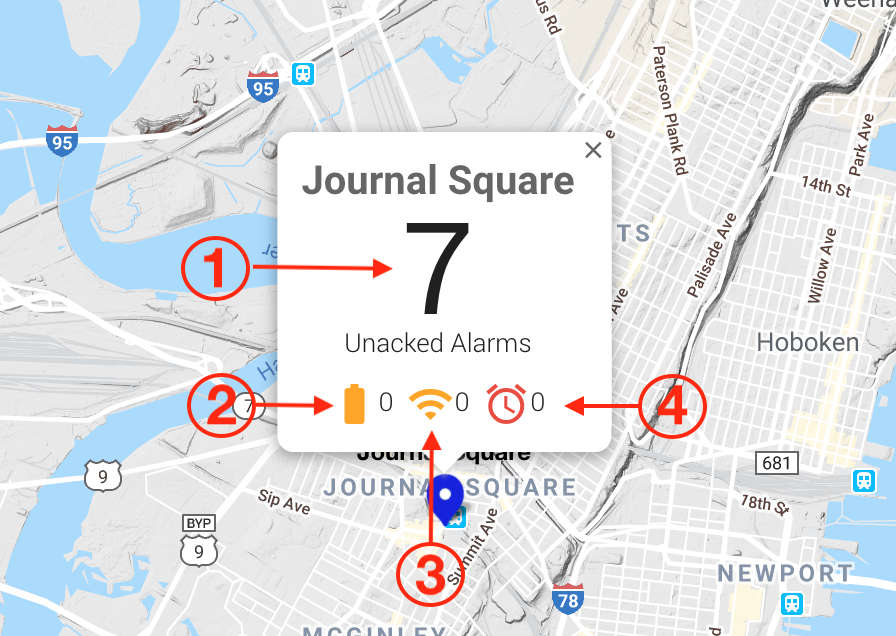
- Unacknowledged Alarms - Number of alarms that need to be acknowledged. To acknowledge, either go to the Alarms tab or to the device's dashboard.
- Low Battery - Number of project's devices with a low battery level.
- Low Signal - Number of project's devices with low signal strength. Note that not all devices are able to report their signal strength, so they won't affect this count.
- Active Alarms - Number of project's devices with an active alarm.
Clicking on the project's name in the tool tip will take you to the Project Screen
Table View Features
The table view displays the following project information:
- Name - Project Name
- Customer - Customer the project is assigned to.
- Address - Address of the project, if address information provided.
- Alarm Status - Indicates the highest severity level if the project as active alarms.
- Primary User - Indicates the designated primary customer user for this project.
- Number of Devices - Number of devices assigned to this project.
Clicking on a project's row will take you to the Project Screen
All columns in the project table can be sorted by clicking on the column name.
Alarm View Features
The alarm view display recent alarms on all active projects in the system.
- Start Time - Date and time the alarm occurred.
- Originator - The serial number of the device generating the alarm.
- Type - Alarms are either Heartbeat or Vibration alarms.
- Severity - The severity level of the alarm. There are 2 severity levels - Critical and Major. Vibration, noise, and dust alarms have a Critical severity level while Heartbeat alarms have a Major severity level.
- Status - Alarms in Inzwa Cloud have 4 possible status.
| Status | Description |
|---|---|
| Active Unacknowledged | Alarm condition currently exists and hasn't been acknowledged by a user. |
| Active Acknowledged | Alarm condition currently exists and has been acknowledged by a user. |
| Cleared Unacknowledged | Alarm condition no longer exists and hasn't been acknowledged by a user. |
| Cleared Acknowledged | Alarm condition no longer exists and has been acknowledged by a user. |
When a user points the cursor at an alarm row, the following alarm actions will become visible.
- Clear - Allows the user to clear an active alarm.
- Share - Allows the user to share the alarm's dashboard with users or distribution groups.
- Acknowledge - Allows the user acknowledge an alarm. In addtion, the user has the option to include a note about the alarm.
- Notes - Allows the user to add a note as well as view notes already added to the alarm.
Clicking a Vibration Event alarm will open the event report dashboard
Project Screen
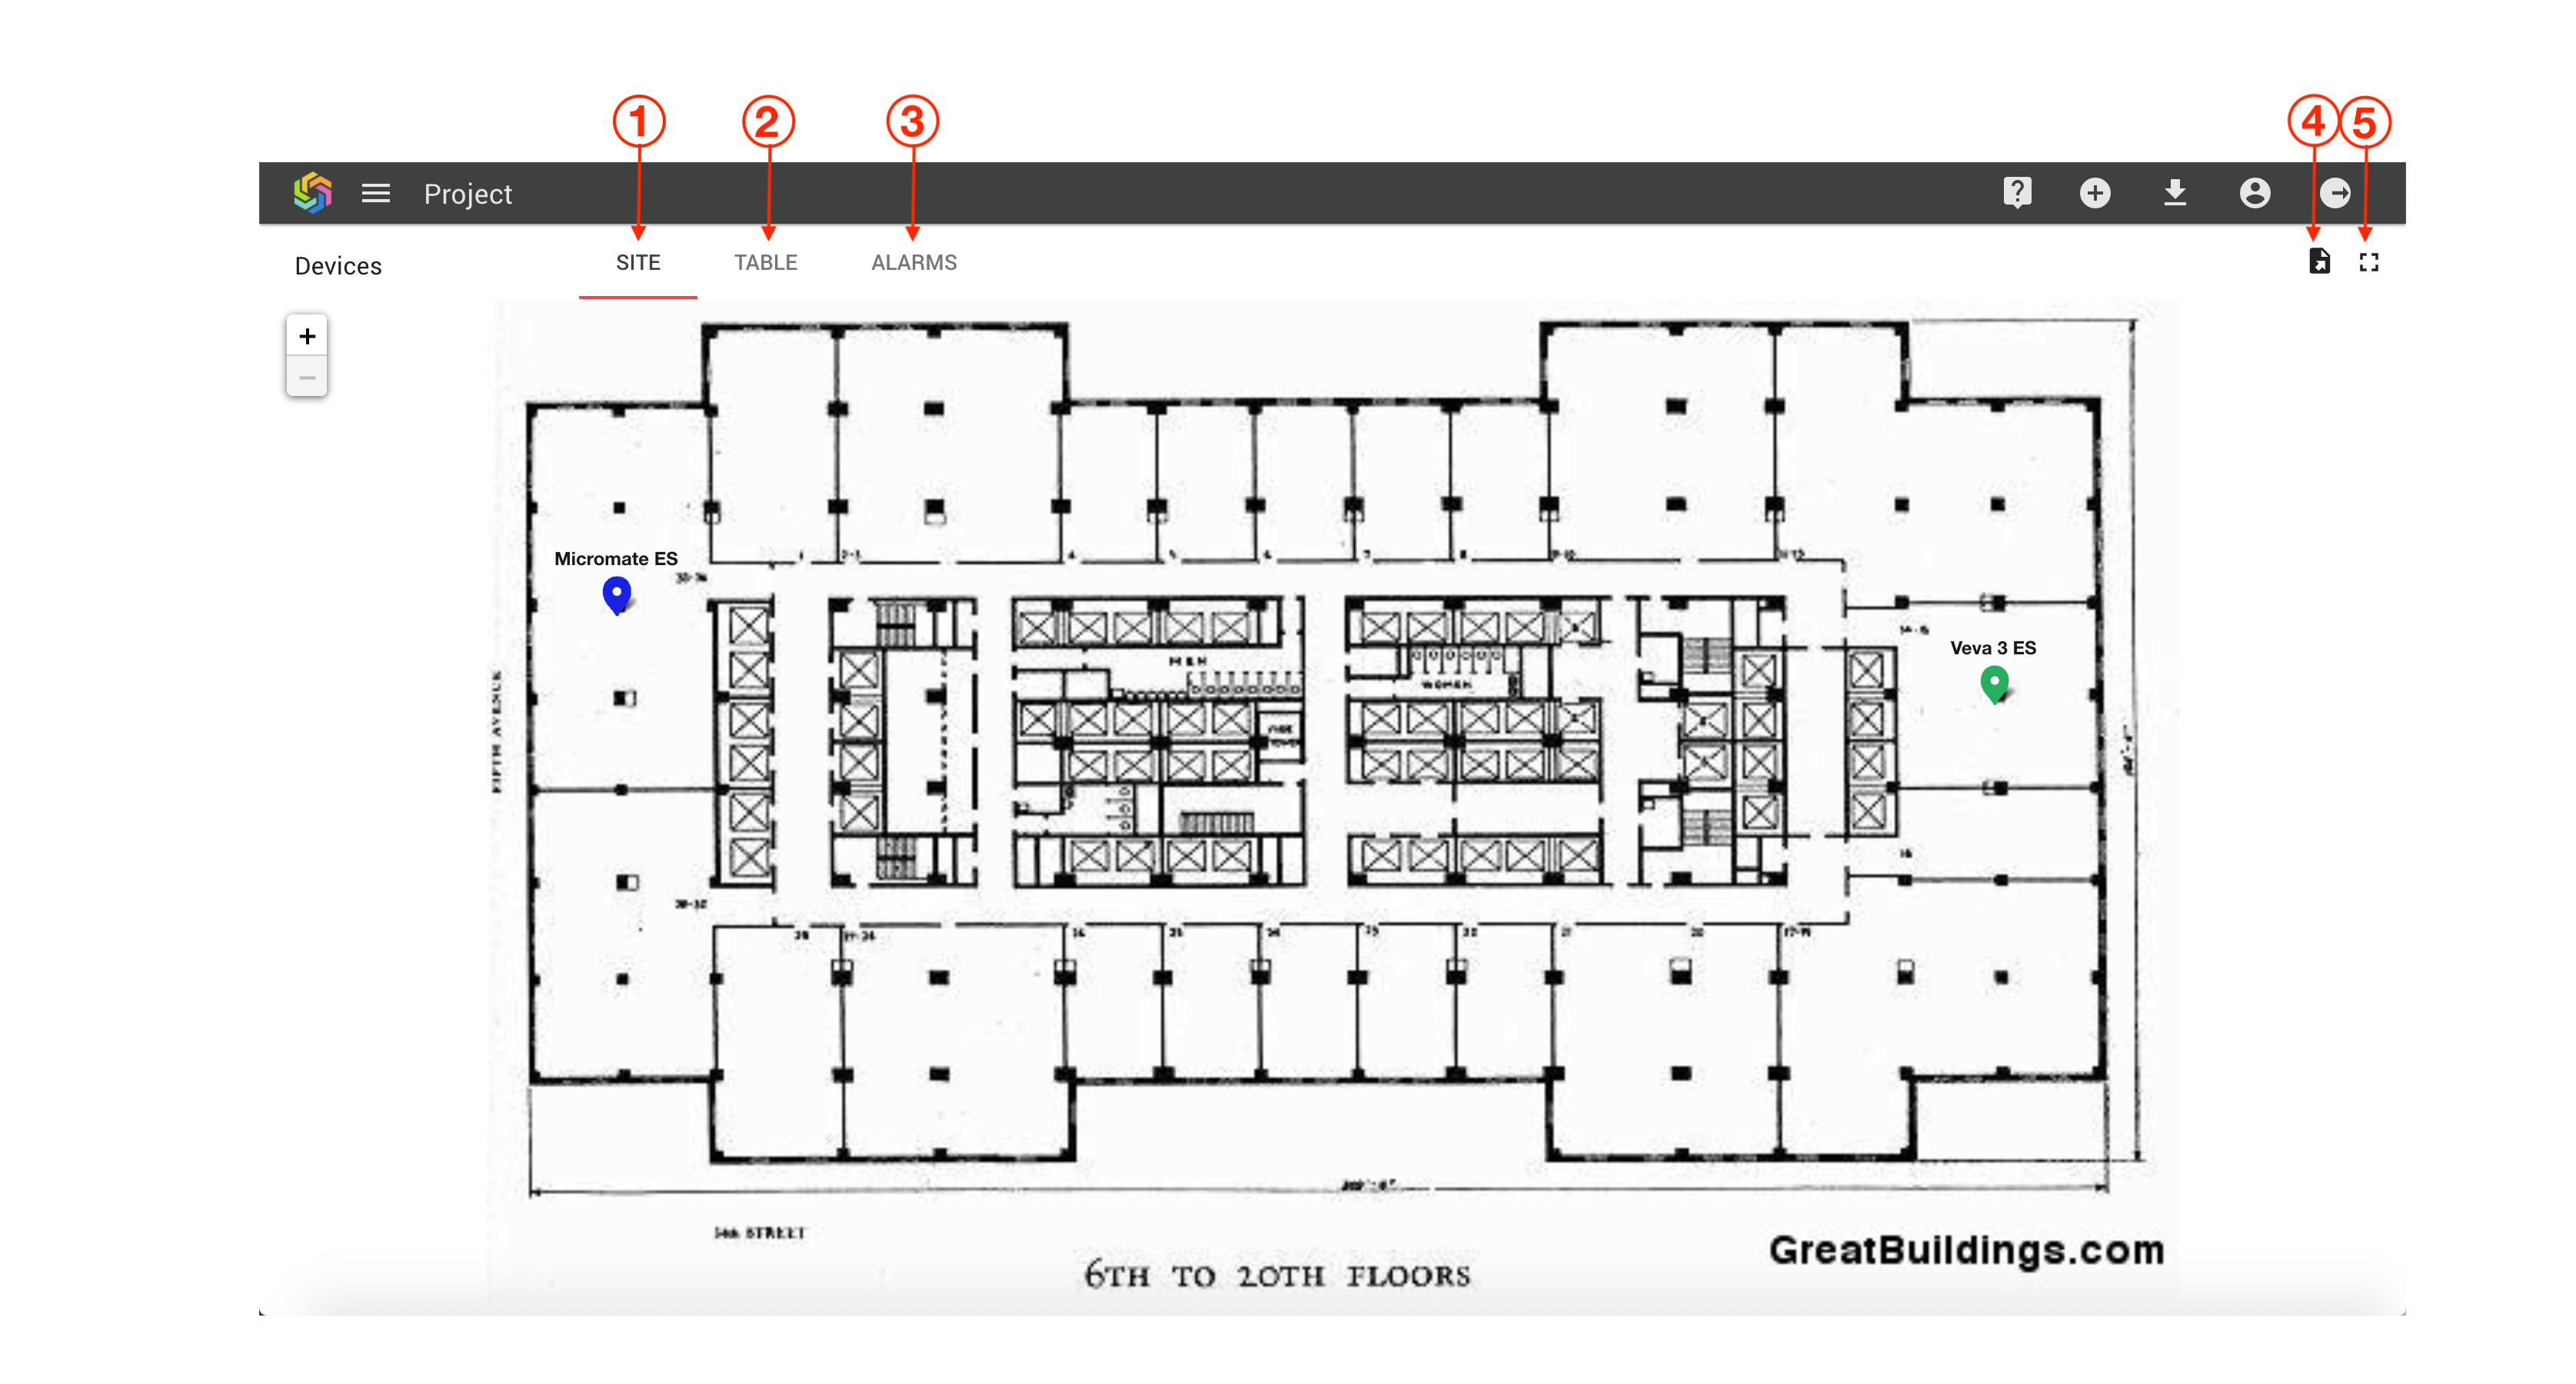
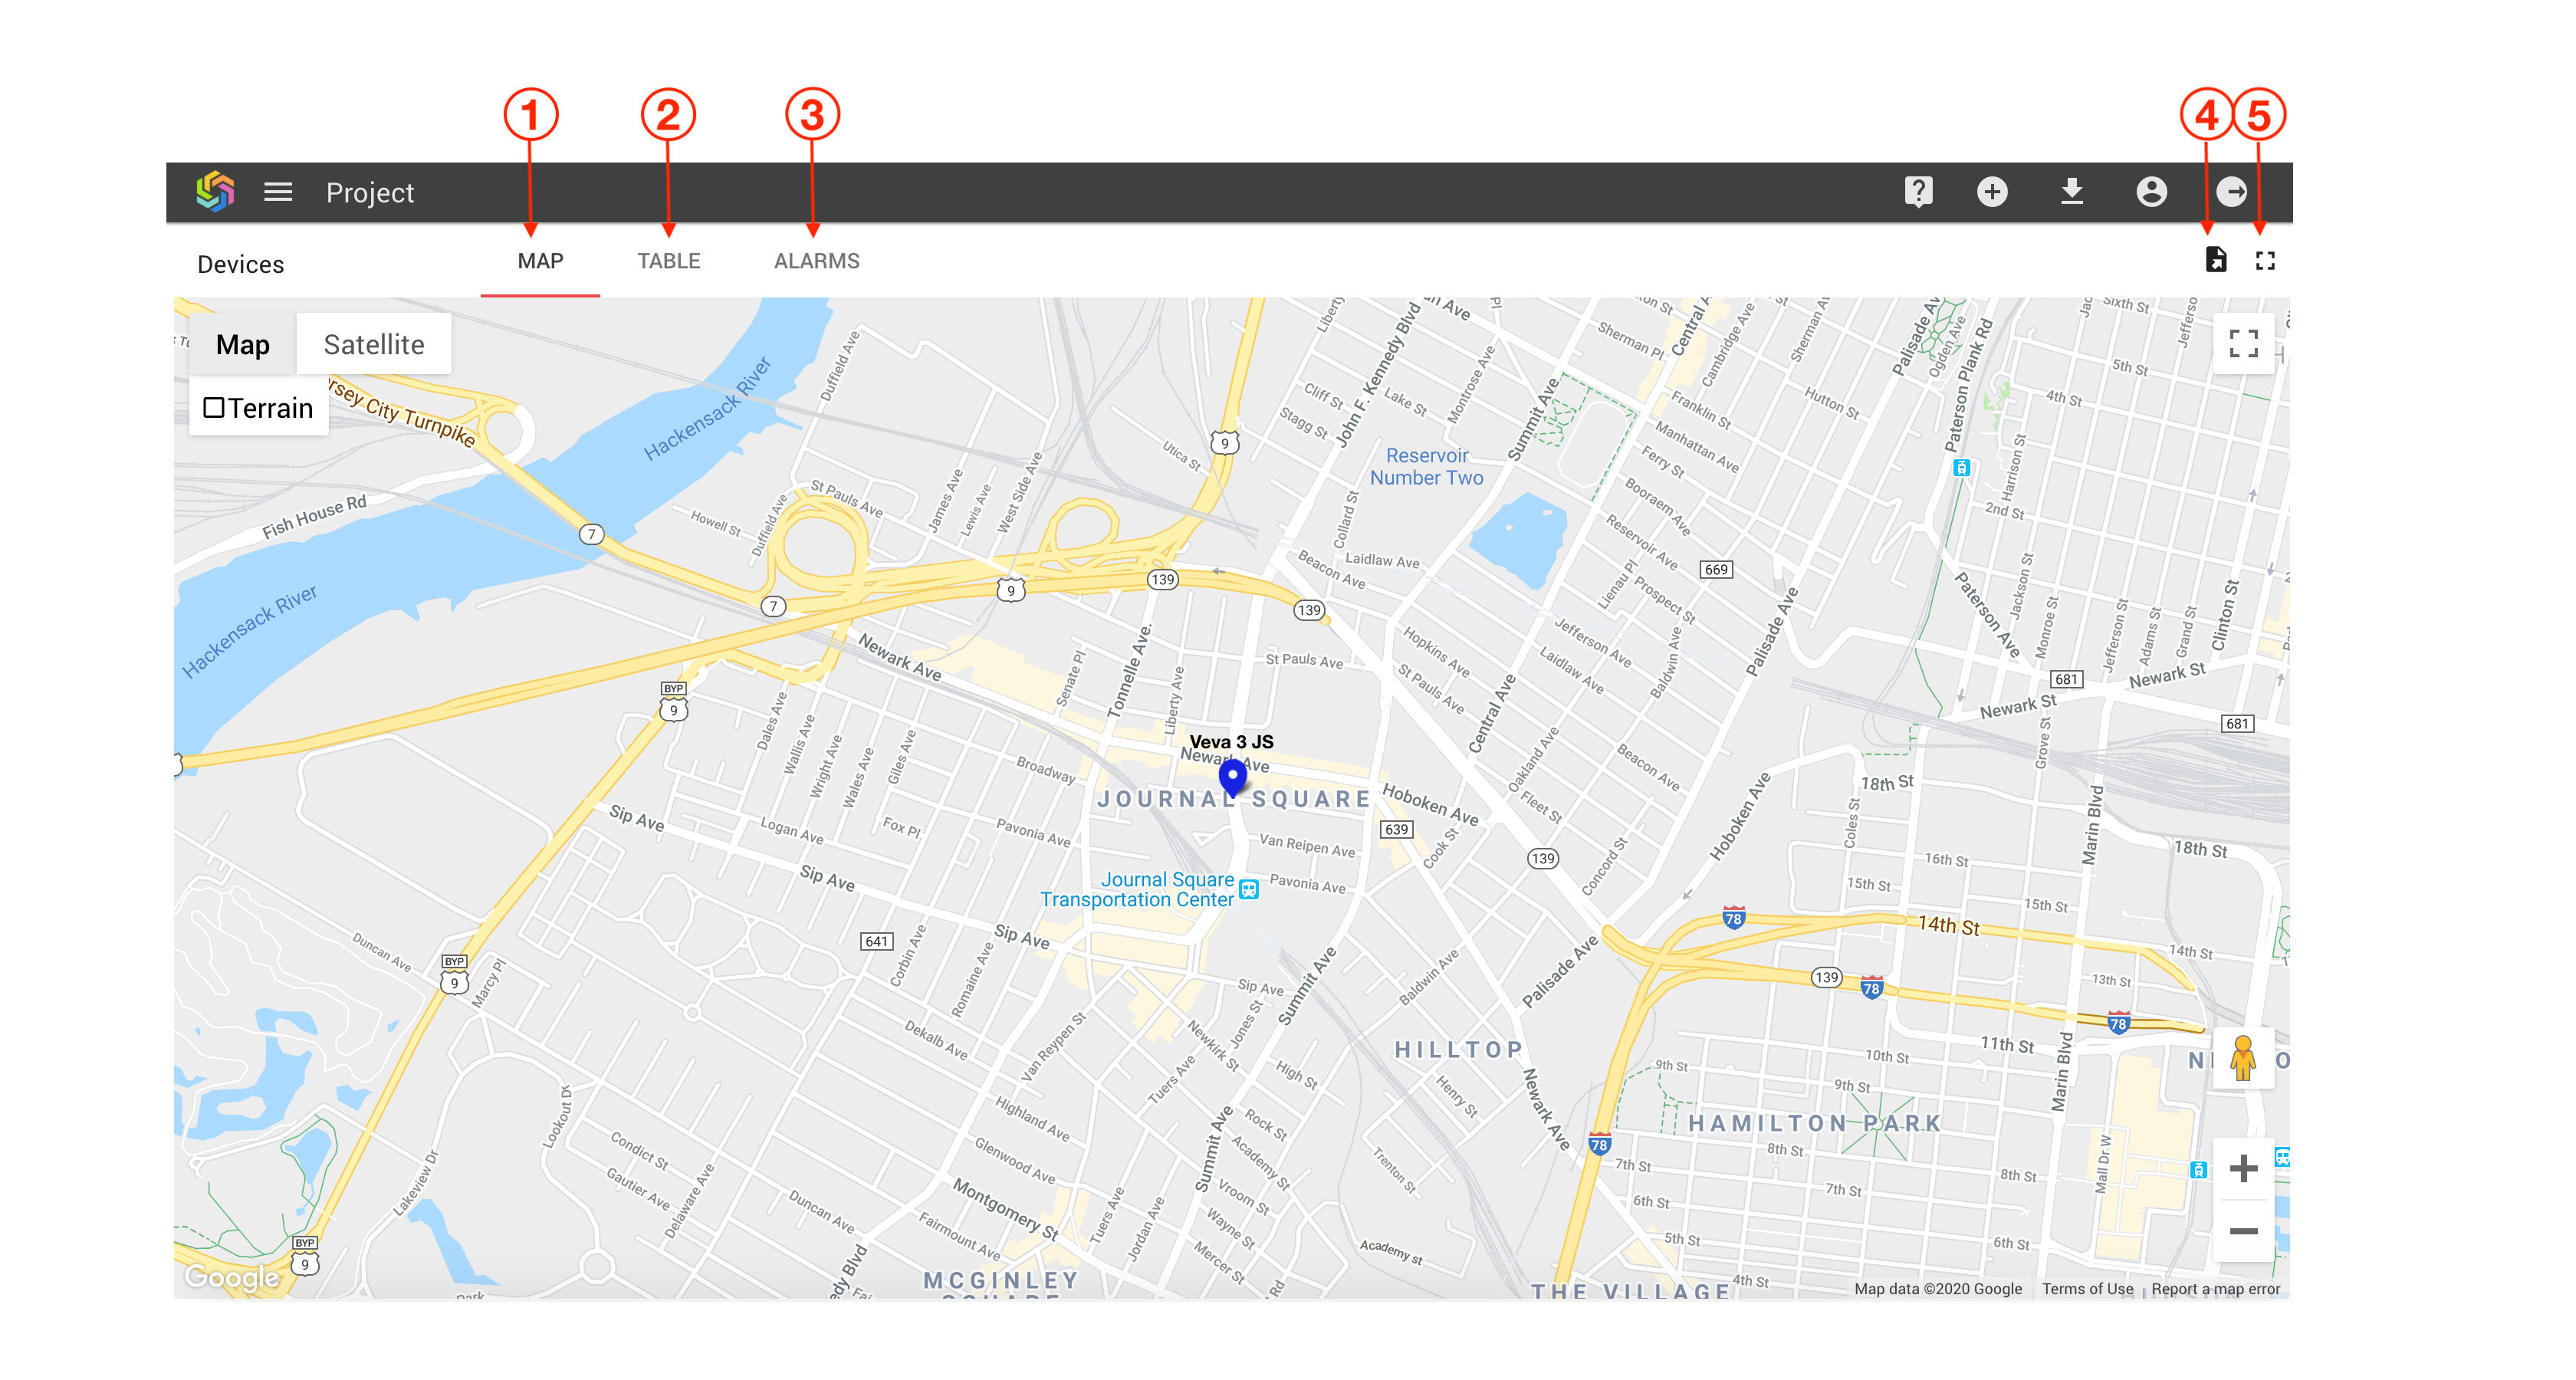
The Project Screen displays devices and information, like alarms, about a specific project. A project's devices can be displayed on either a map view or a site view as shown in the images below. When a project is configured with a display image, only the site view be available. Otherwise, devices will be shown on a map if the device has location information configured.
Sub-navigation Features
The Project Screen has a sub-navigation bar with these features:
- Map/Site View (All users) - If at least one project is configured with an address or latitude/longitude coordinates, the map view will appear on the home screen and will be the default view. However, if a project is configured with an uploaded image, then the map view will be overridden.
- Table View (All users) - All active projects also appear in a table view. This will be the default view if no projects have address or latitude/longitude coordinates.
- Alarms View (All users) - All recent alarm activity for all projects is shown in the alarm view.
- Export Data (All users) - Export data about the projects displayed on the Home Screen.
- Full Screen (All users) - Click to display in full screen mode.
Map and Site View Features
In the map and site views, each device is marked with a colored pin that designates the current status of that project. The meaning of each color is described in the following table. When a project has more than one status active, Inzwa Cloud will display the highest level of severity.
| Marker | Status Description |
|---|---|
| Device has active alarms. | |
 | The device has a low battery or signal strength. |
 | The device has unacknowledged alarms. |
| Nothing requiring attention on this device. |
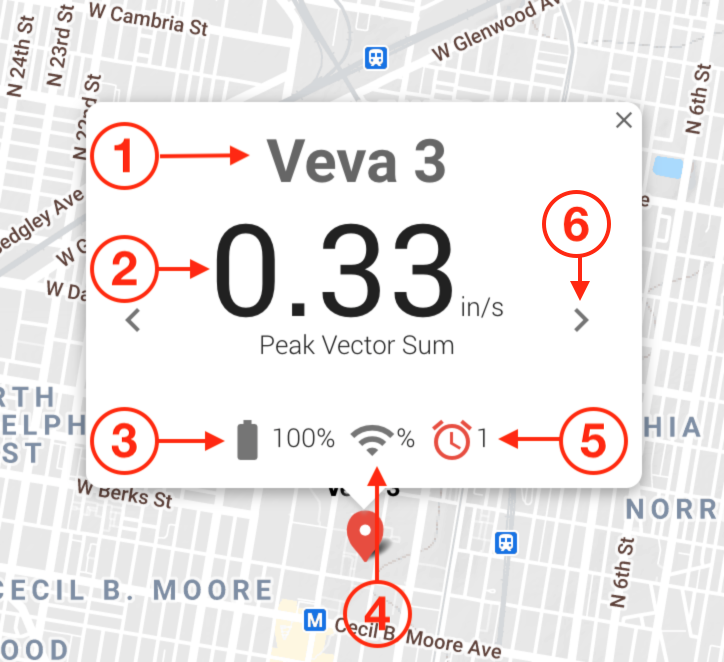
The map and site views also display detailed information about each device. By clicking on a device's pin, you can view a tooltip displaying details about the device. The information displayed varies by device type.
- Device Label - User entered device label.
- Latest Value(s) - The latest value(s) received from the device. This varies depending on the device type.
- Battery Level - Estimated battery power remaining.
- Signal Level - Device's signal strength.
- Active Alarms - Number of active alarms on the device.
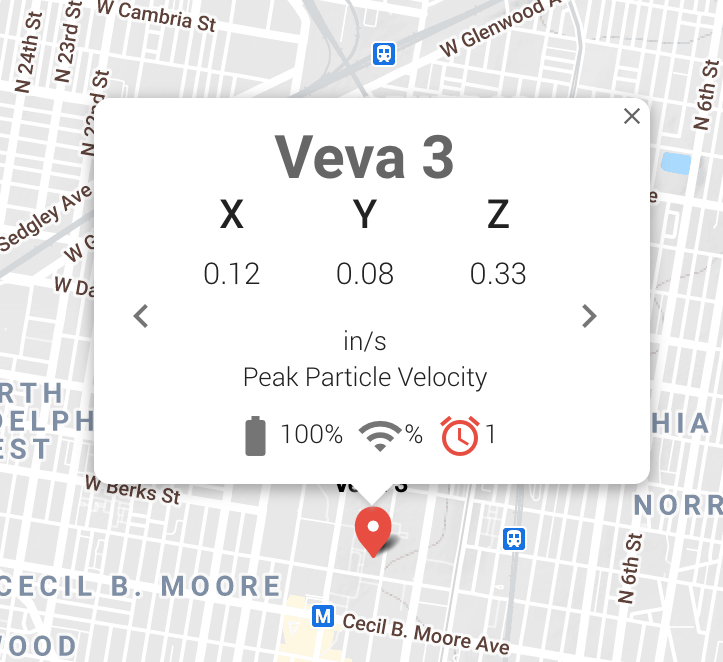
- Slider Controls - When available, click arrows on either side of panel to change the view.
Clicking on a device's label will take you to the device screen.
This chart outlines the data values that will be displayed in the device tool tip for each device type.
| Device Type | Latest Values Displayed | Battery Level | Signal Level | Active Alarm |
|---|---|---|---|---|
| Inzwa Veva 3 | PVS | |||
| Instantel® Micromate® | PVS, PPC & Sound Level | |||
| Instantel® Minimate® Plus & Pro | PVS, PPC & Sound Level | |||
| Syscom® MR3000® | PVS | |||
| Avongard Tell-Tale or similar | Displacement | |||
| Topcon MS Series | Unacknowleged Alarms | |||
| Aeroqual PM10 | Particle Density |
Table View Features
The table view displays the following project information:
- Serial Number - Device serial number.
- Device Label - User provided device label.
- Assigned Project - Project this device is assigned to.
- Alarm Status - Indicates the highest severity level if the device as active alarms.
- Last Data Acquisition - Indicates the date and time data was last received from the device.
Clicking on a device's row will take you to the device's dashboard.
All columns in the device table can be sorted by clicking on the column name.
Alarm View Features
The alarm view on the Project Screen functions the same as the alarm view on the Home Screen.
Device Dashboards
A device dashboard presents data collected by a device in a manner appropriate for its application. Typically, four different types of data are presented - latest value, trend, historical table and alarm. This section describes each type followed by example device dashboards for each type of device supported by Inzwa Cloud.
The device dashboard can be customized to your needs. Please contact Inzwa support for more details.
Latest Value Chart
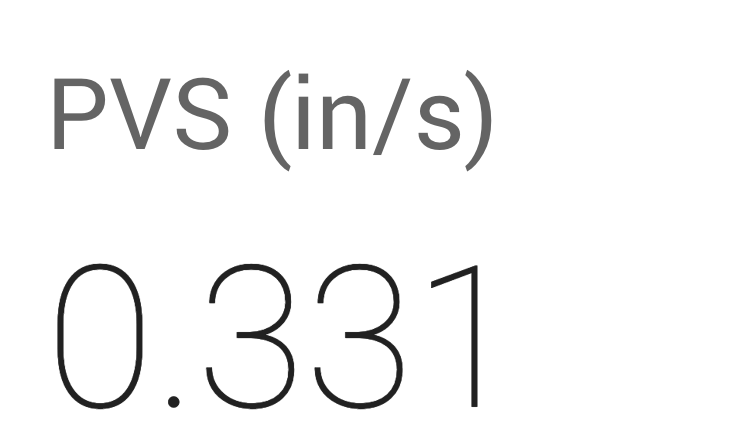
Latest value charts simply display the last value received from the device for the given property.
Trend Chart
Trend charts display data collected over time. Examples of a trend chart include peak particle velocity measurements from vibration monitors to particle density measurements from dust monitors. Inzwa Cloud has a standard features for interacting with these charts.

- Time Frame Selector - The trend chart defaults to display a time frame of collected data. Clicking on the time frame selector opens a dialog that allows you to select from a pre-defined list of time periods or set a start and end date and time of data data to display.
- Data Export - Export the presented data in either CSV or XLS format.
- Display Full Screen - Displays the chart full screen. Click this icon a 2nd time to return to normal view.
- Legend - Displays the dataseries name and market colors. Clicking on each dataseries name toggles the display of that data on/off.
- Tool Tip - Rolling your mouse over the data points will display a tool tip showing the time and values of the data.
Clicking, then dragging within the chart allows you to select an area of the chart to zoom into.
Historical Table
Historical tables display data collected over time typically in reverse chronological order.

- Time Frame Selector - The trend chart defaults to display a time frame of collected data. Clicking on the time frame selector opens a dialog that allows you to select from a pre-defined list of time periods or set a start and end date and time of data data to display.
- Search - Use this tool to search for specific values in the table.
- Data Export - Export the presented data in either CSV or XLS format.
- Display Full Screen - Displays the chart full screen. Click this icon a 2nd time to return to normal view.
- Pagination Tool - Determine the amount of rows to display per page. Also, navigate through the data using the first, previous, next, or last buttons.
Click on column headers to change the table's sort order.
Alarm View
The alarm view on the device dashboard functions the same as the alarm view on the Home Screen.
Device Dashboard Examples
Vibration Device Dashboard
(applies to Inzwa Veva 3 and Syscom® MR3000) 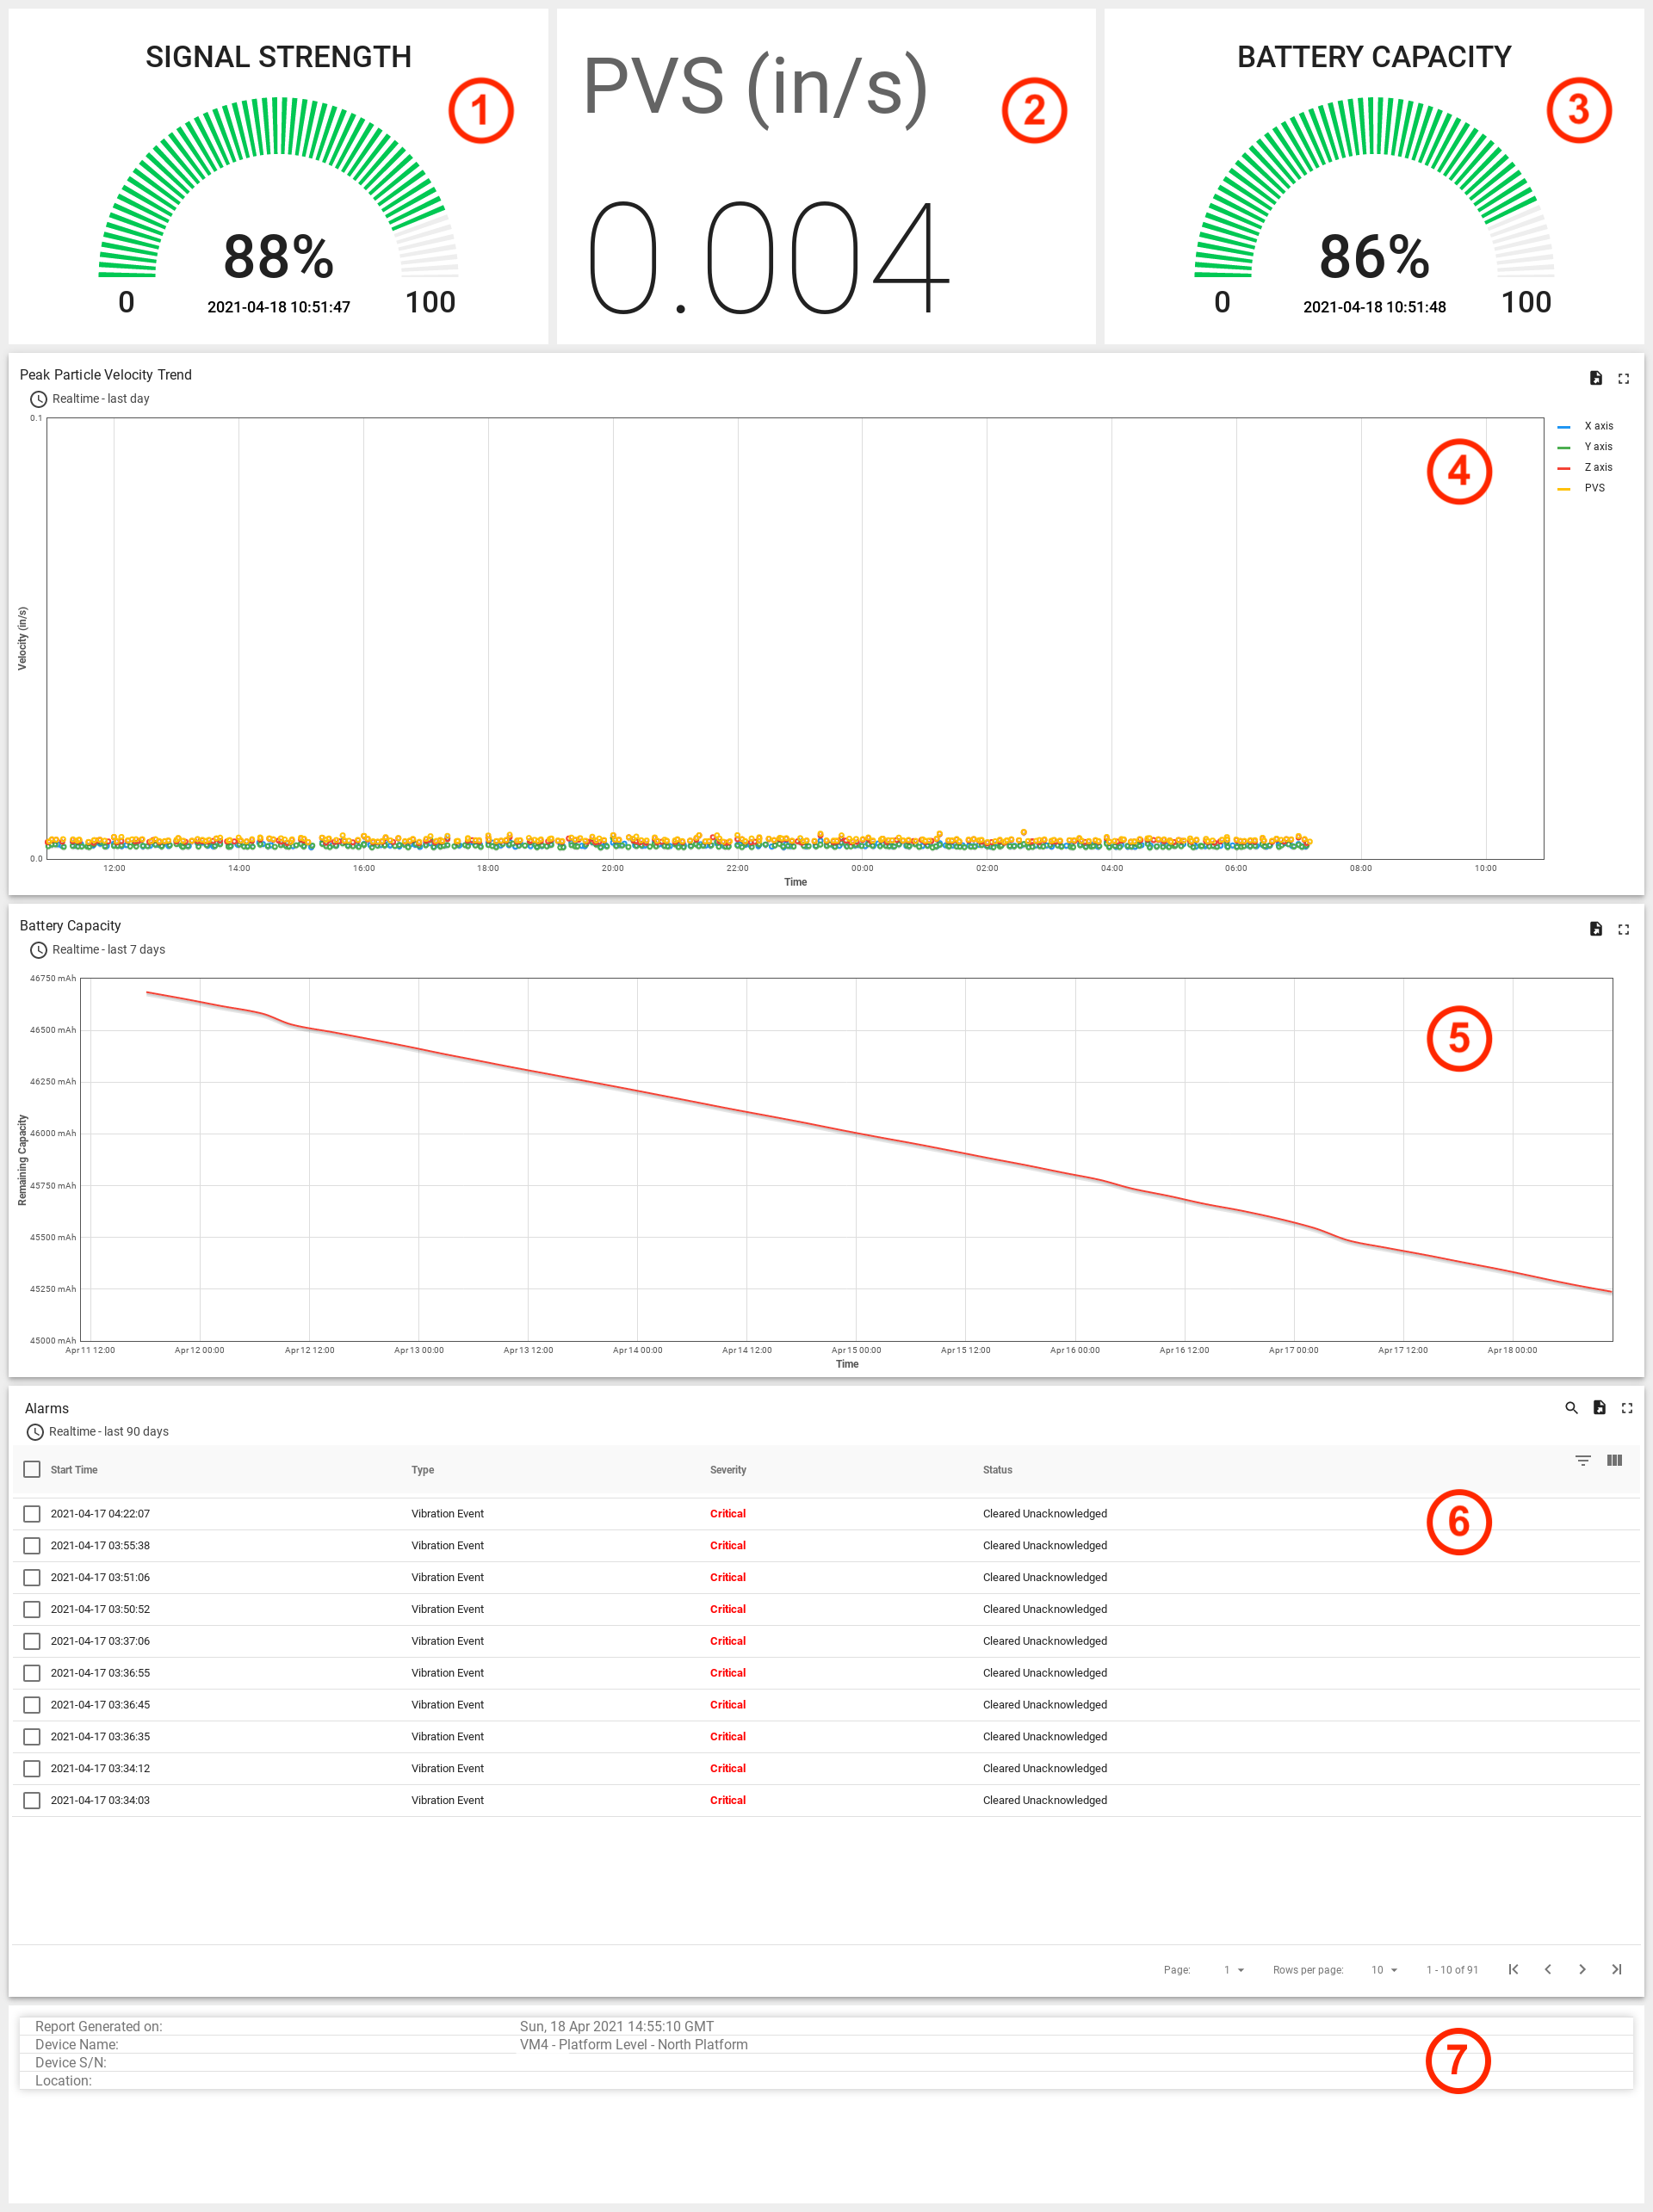
The vibration monitor device dashboard displays the following information:
- Link Quality (Inzwa Veva 3 only) - Latest link quality value with last update time.
- PVS - Latest PVS value received from the device.
- Battery - Percentage of battery capacity remaining with last update time.
- Peak Particle Velocity Trend - This chart displays the peak particle velocity(PPV) and the peak vector sum (PVS) data collected by the device at user configured intervals.
- Battery Capacity Trend - This chart displays the historical trend of the remaining battery capacity.
- Alarms - Historical list of alarms occurring on this device. Clicking on an 'Vibration Event' alarm row will open the Alarm Report.
- Report Footer - Includes device serial number, label, location (if configured), and date the dashboard was generated.
Vibration and Noise Device Dashboard
(applies to Instantel® Micromate® and Minimate®) 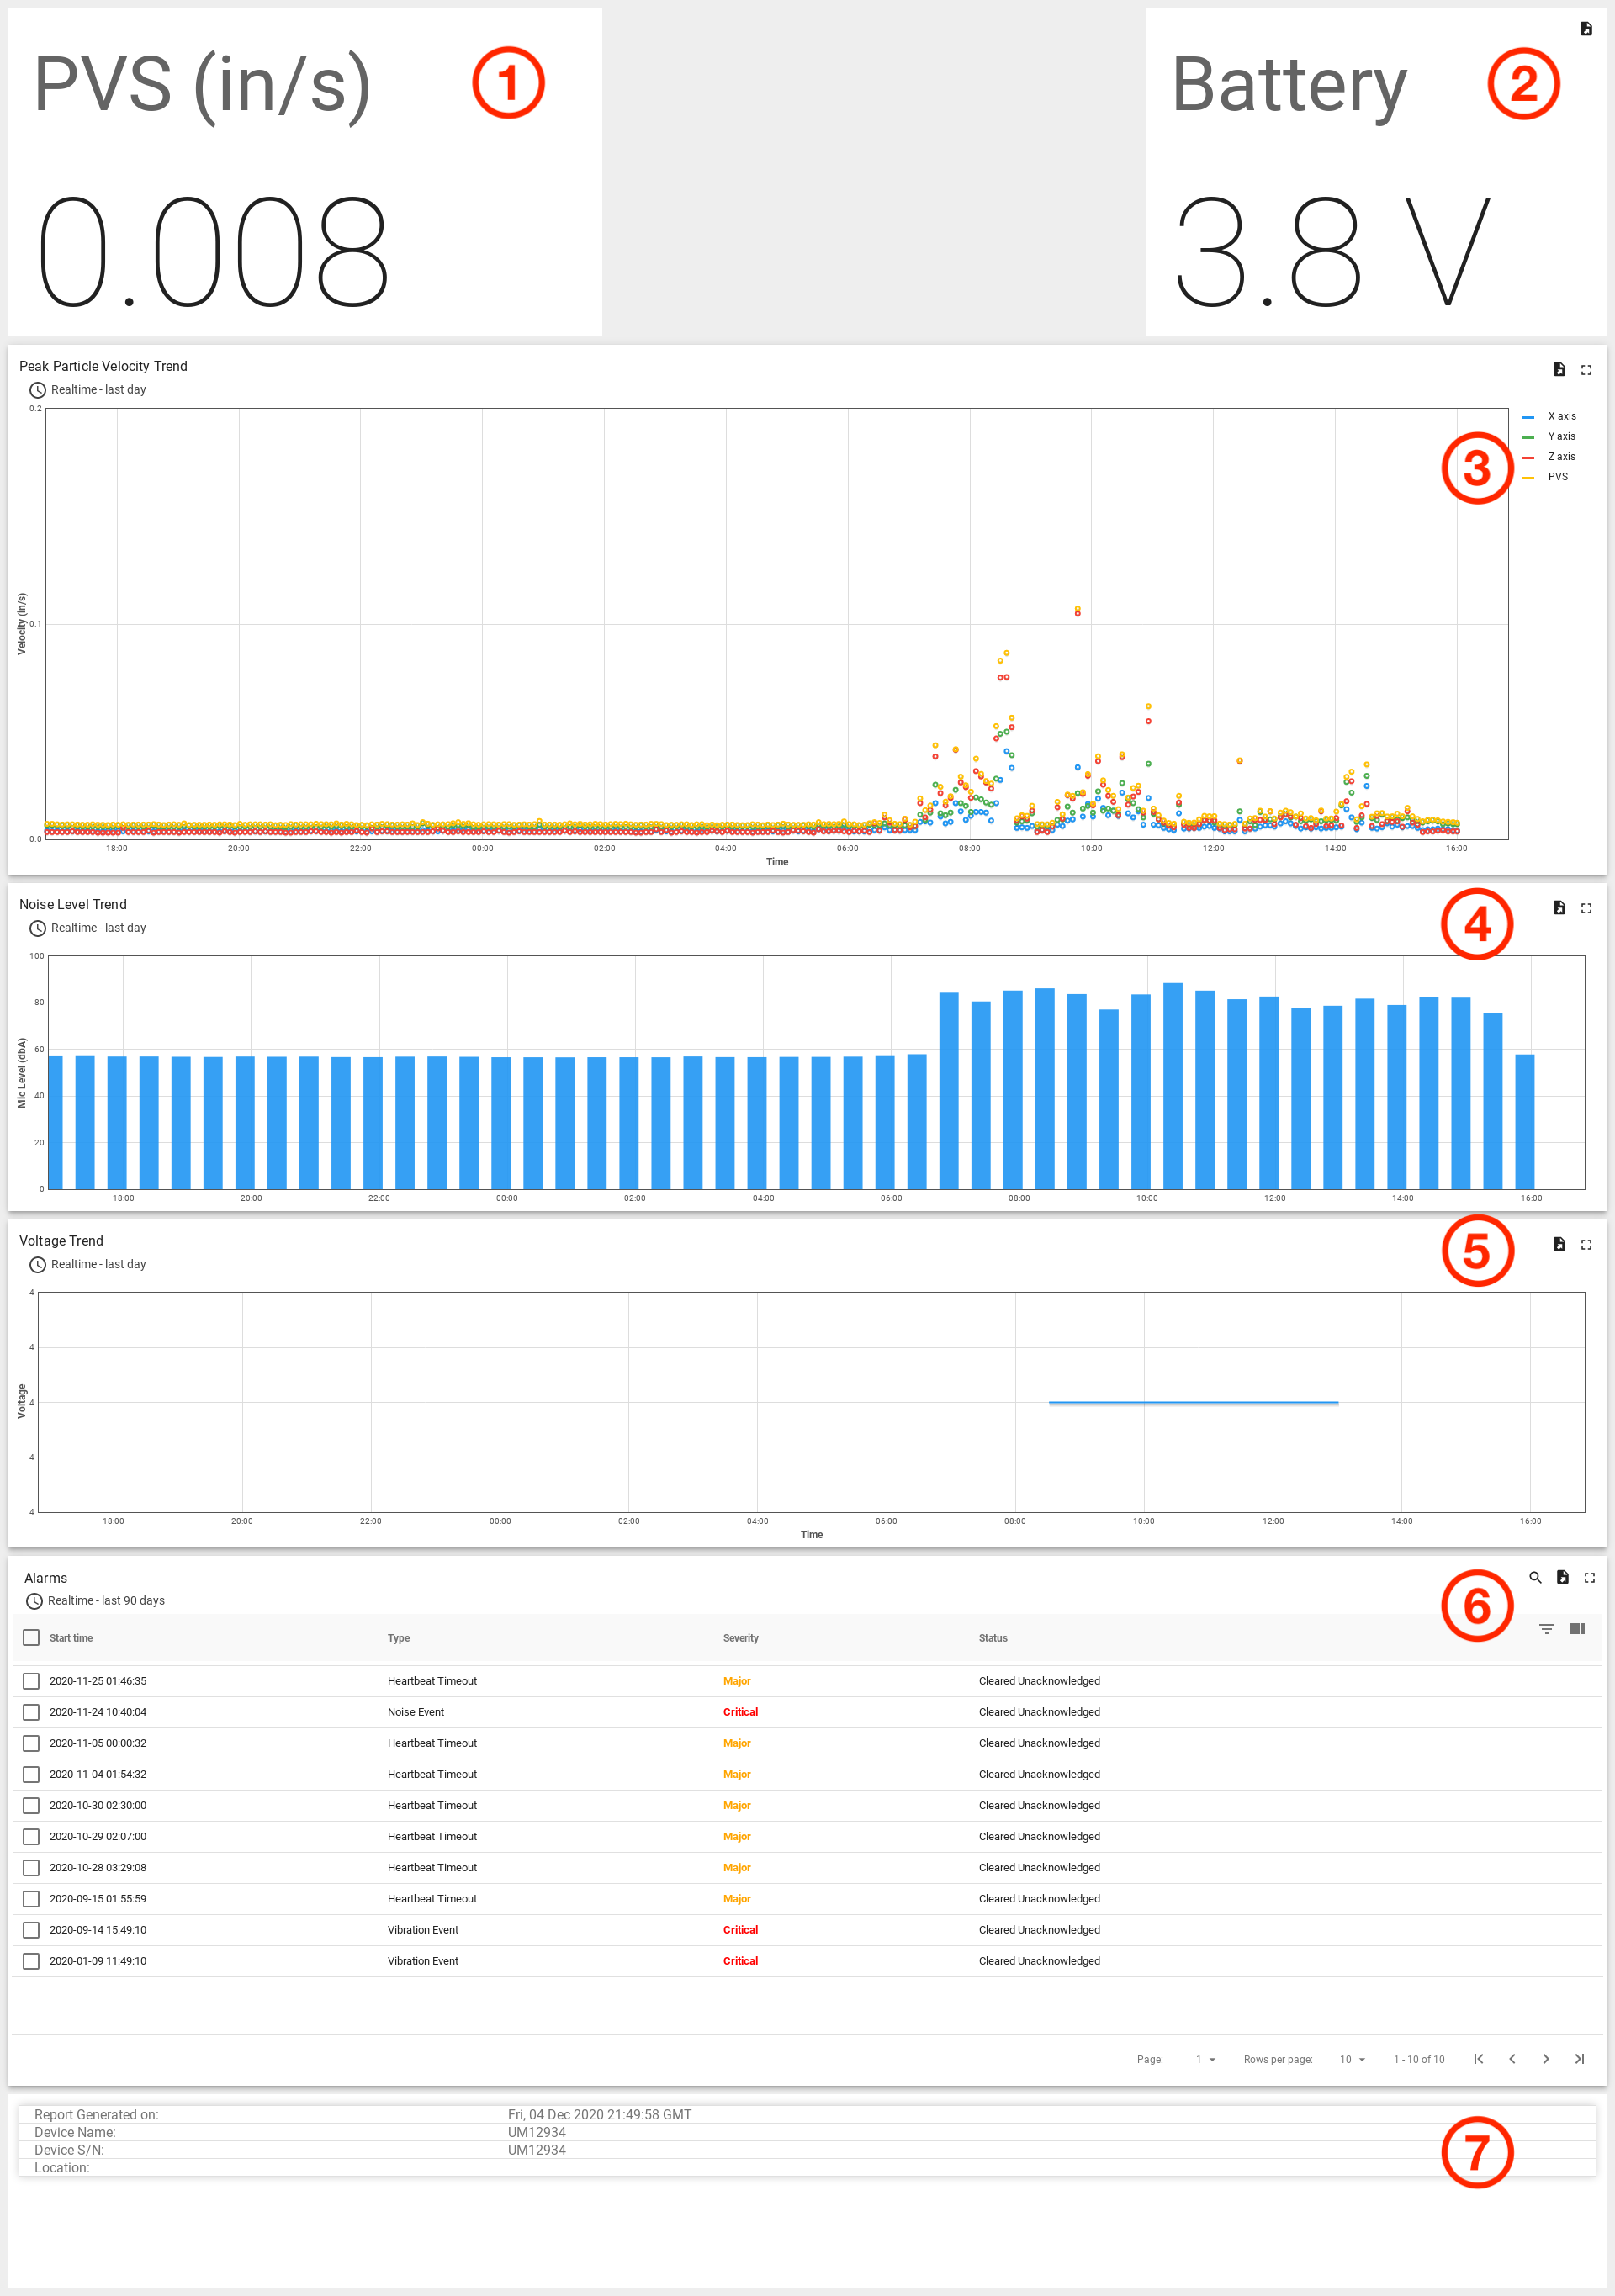
The vibration and noise monitoring device dashboard displays the following information:
- PVS - Latest PVS value received from the device.
- Battery - Latest battery voltage received from the device.
- Peak Particle Velocity Trend - This chart displays the peak particle velocity(PPV) and the peak vector sum (PVS) data collected by the device at user configured intervals.
- Noise Level Trend - This chart displays the noise level data collected by the device at user configured intervals.
- Voltage Trend - This chart displays the battery voltage data collected over time.
- Alarms - Historical list of alarms occurring on this device. Clicking on an 'Vibration Event' or 'Noise Event' alarm row will open the Alarm Report.
- Report Footer - Includes device serial number, label, location (if configured), and date the dashboard was generated.
Sound Level Monitor Dashboard
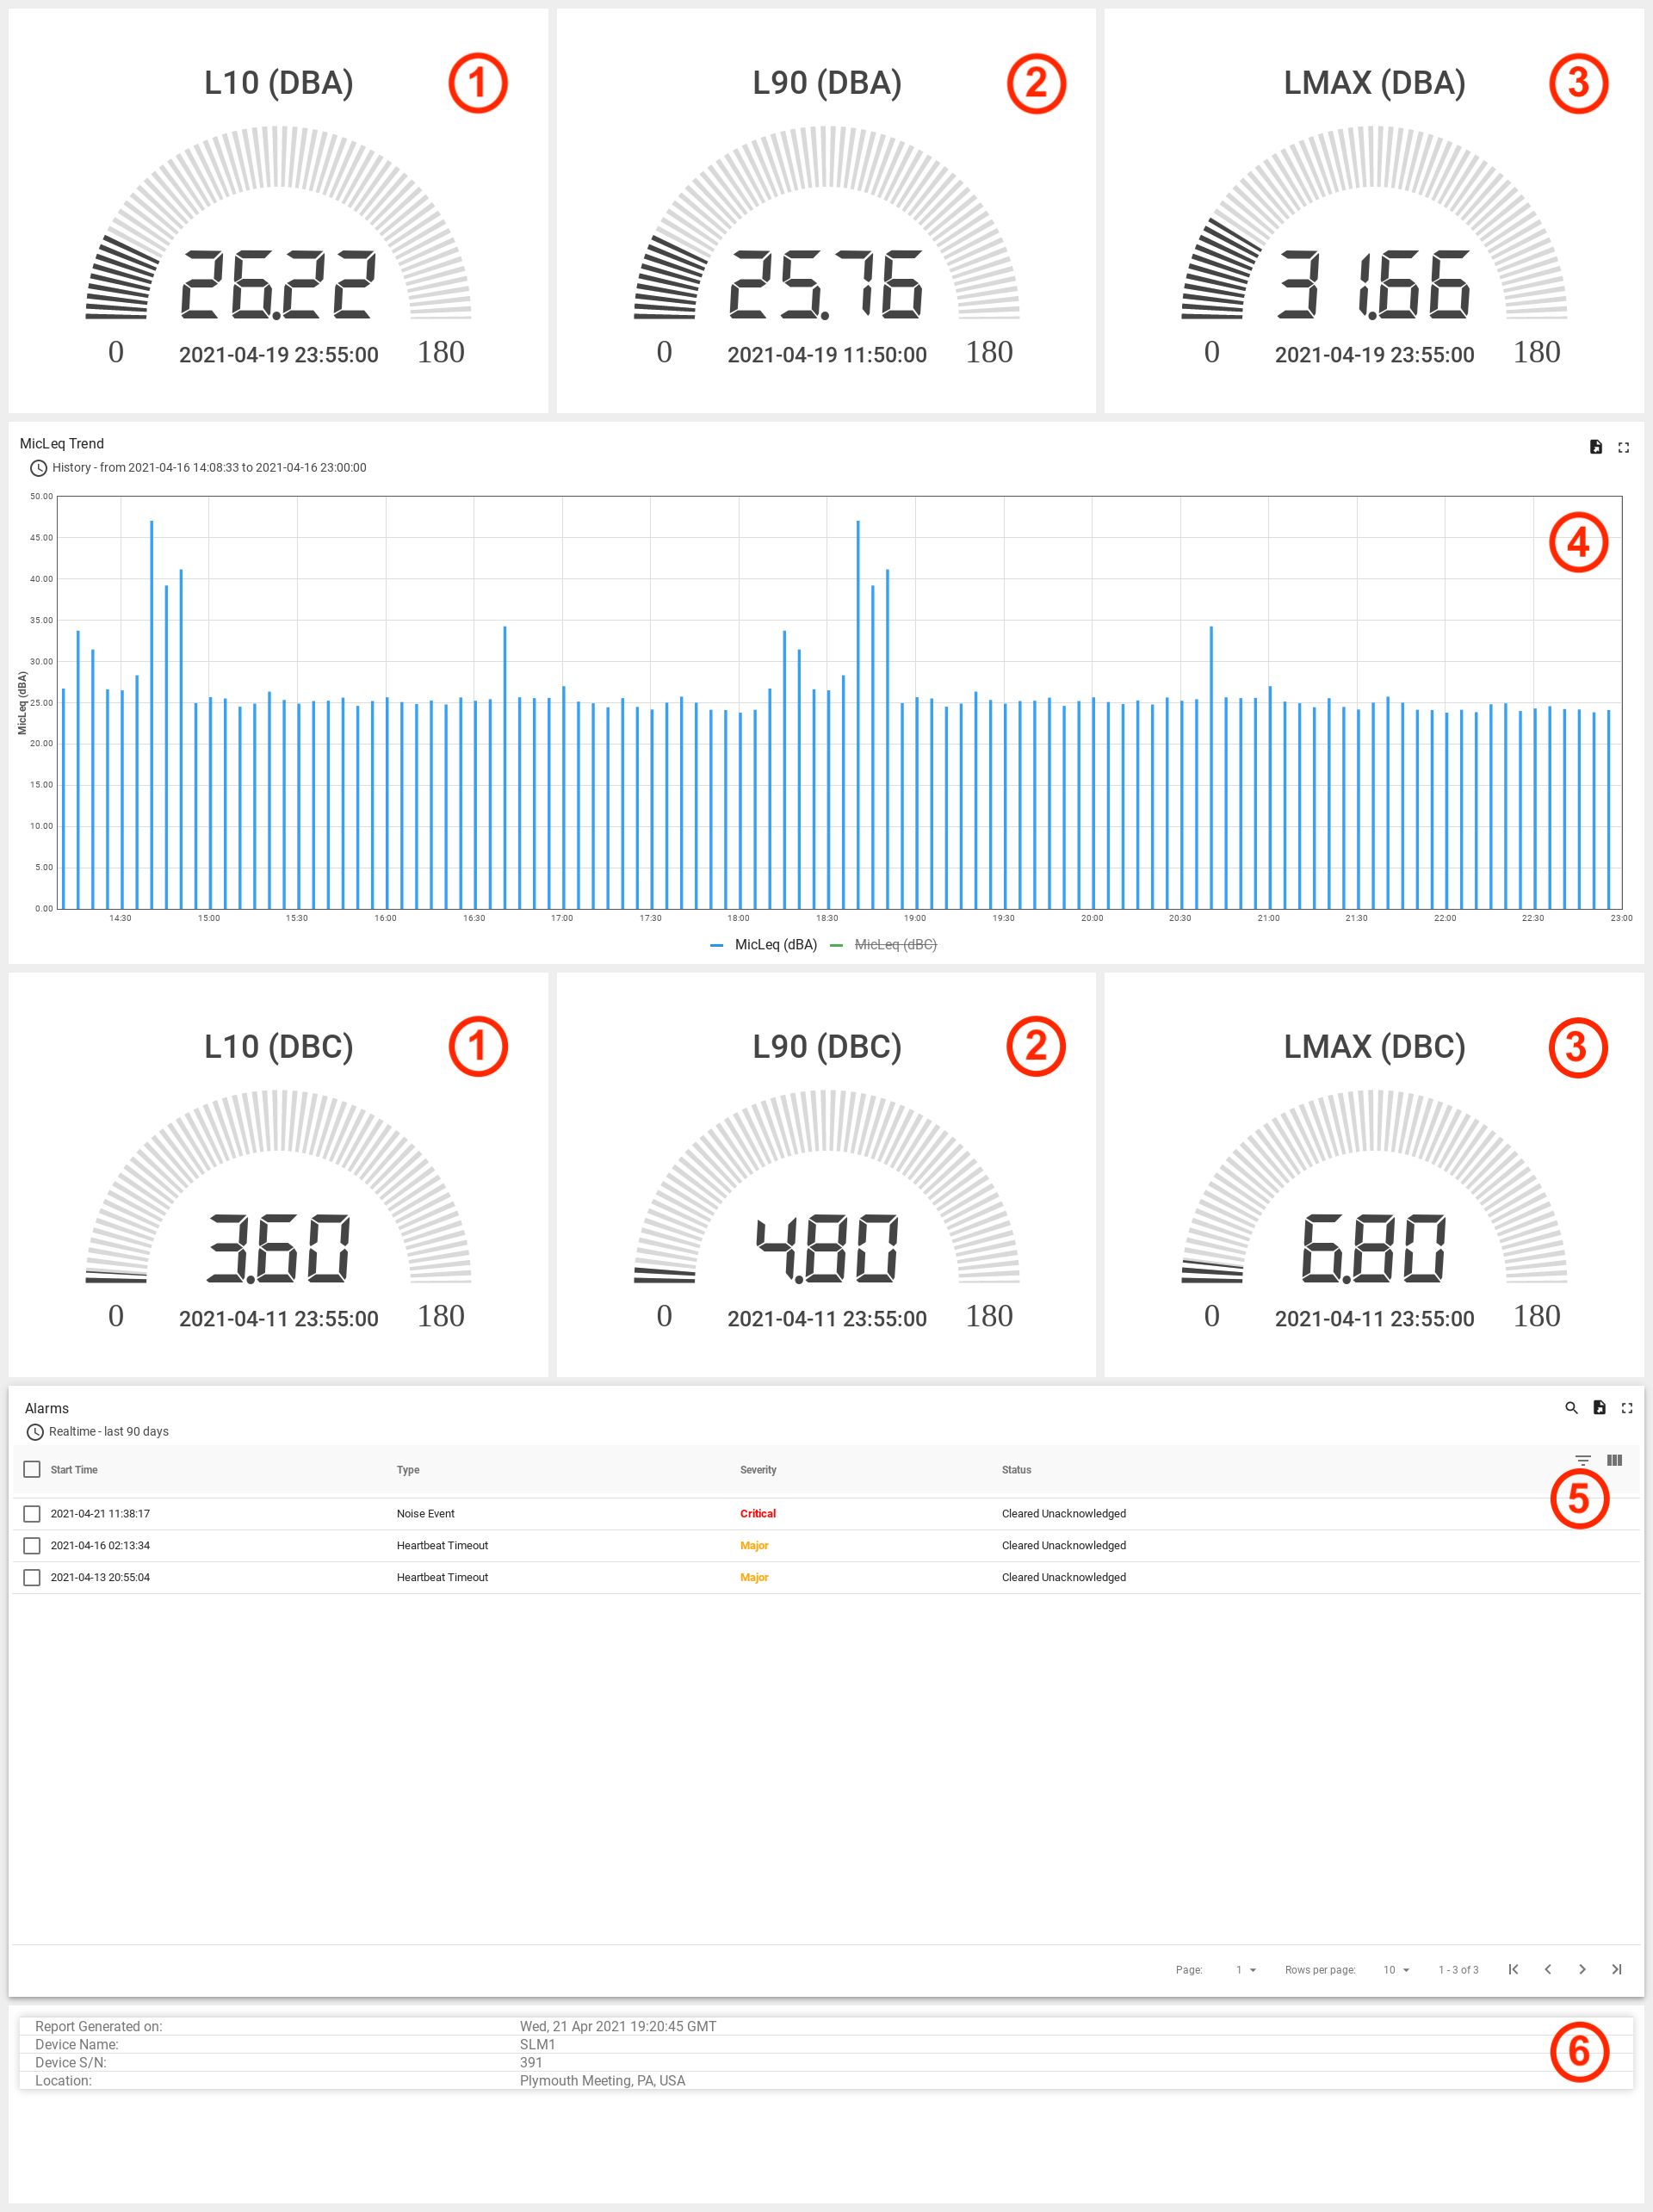
The sound level monitoring device dashboard displays the following information:
- L10 Sound Level - Latest L10 value received from the device. Both A and C weighted values are shown.
- L90 Sound Level - Latest L90 value received from the device. Both A and C weighted values are shown.
- Lmax Sound Level - Latest Lmax value received from the device. Both A and C weighted values are shown.
- Leq Trend - This chart displays both the A and C weighted Leq data. Note the C weighted data is hidden by default. Click on the legend to display data, if it exists.
- Alarms - Historical list of alarms occurring on this device.
- Report Footer - Includes device serial number, label, location (if configured), and date the dashboard was generated.
Dust Monitor Device Dashboard
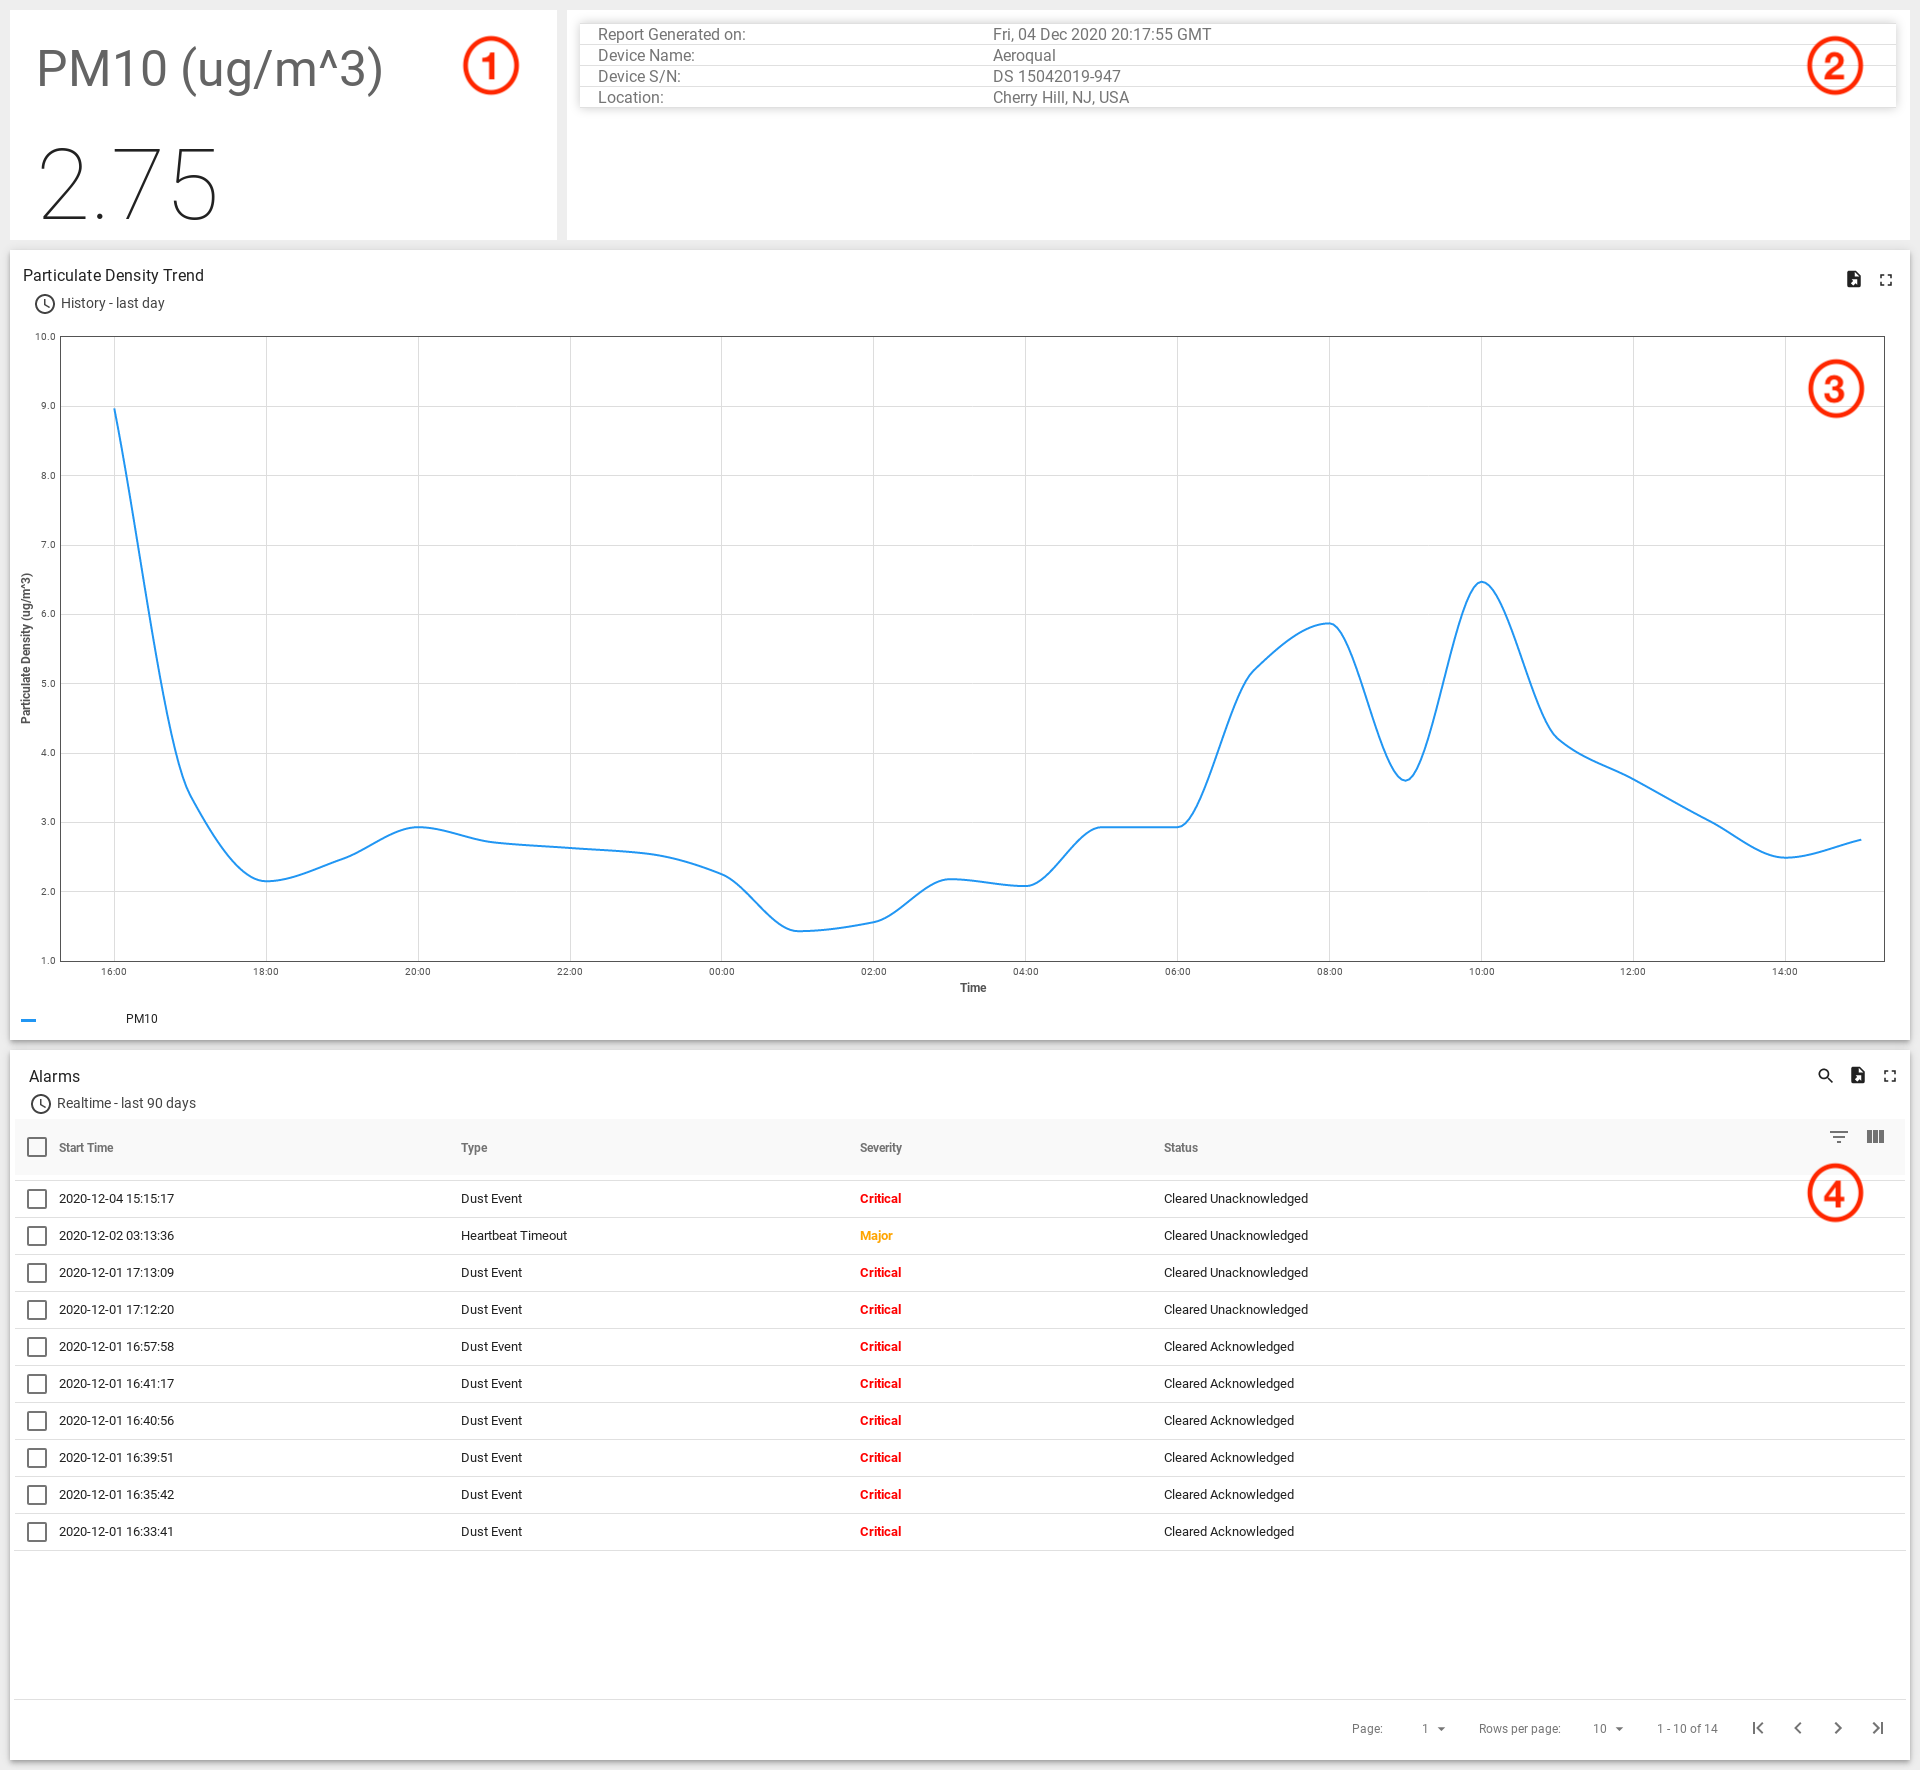
The dust monitoring device dashboard displays the following information:
- PM10 - Latest PM10 value received from the device.
- Report Header - Includes device serial number, label, location (if configured), and date the dashboard was generated.
- Particulate Density Level Trend - This chart displays the particulate density data collected by the device.
- Alarms - Historical list of alarms occurring on this device.
Total Station Device Dashboard
(applies to Topcon MS Series Total Stations) 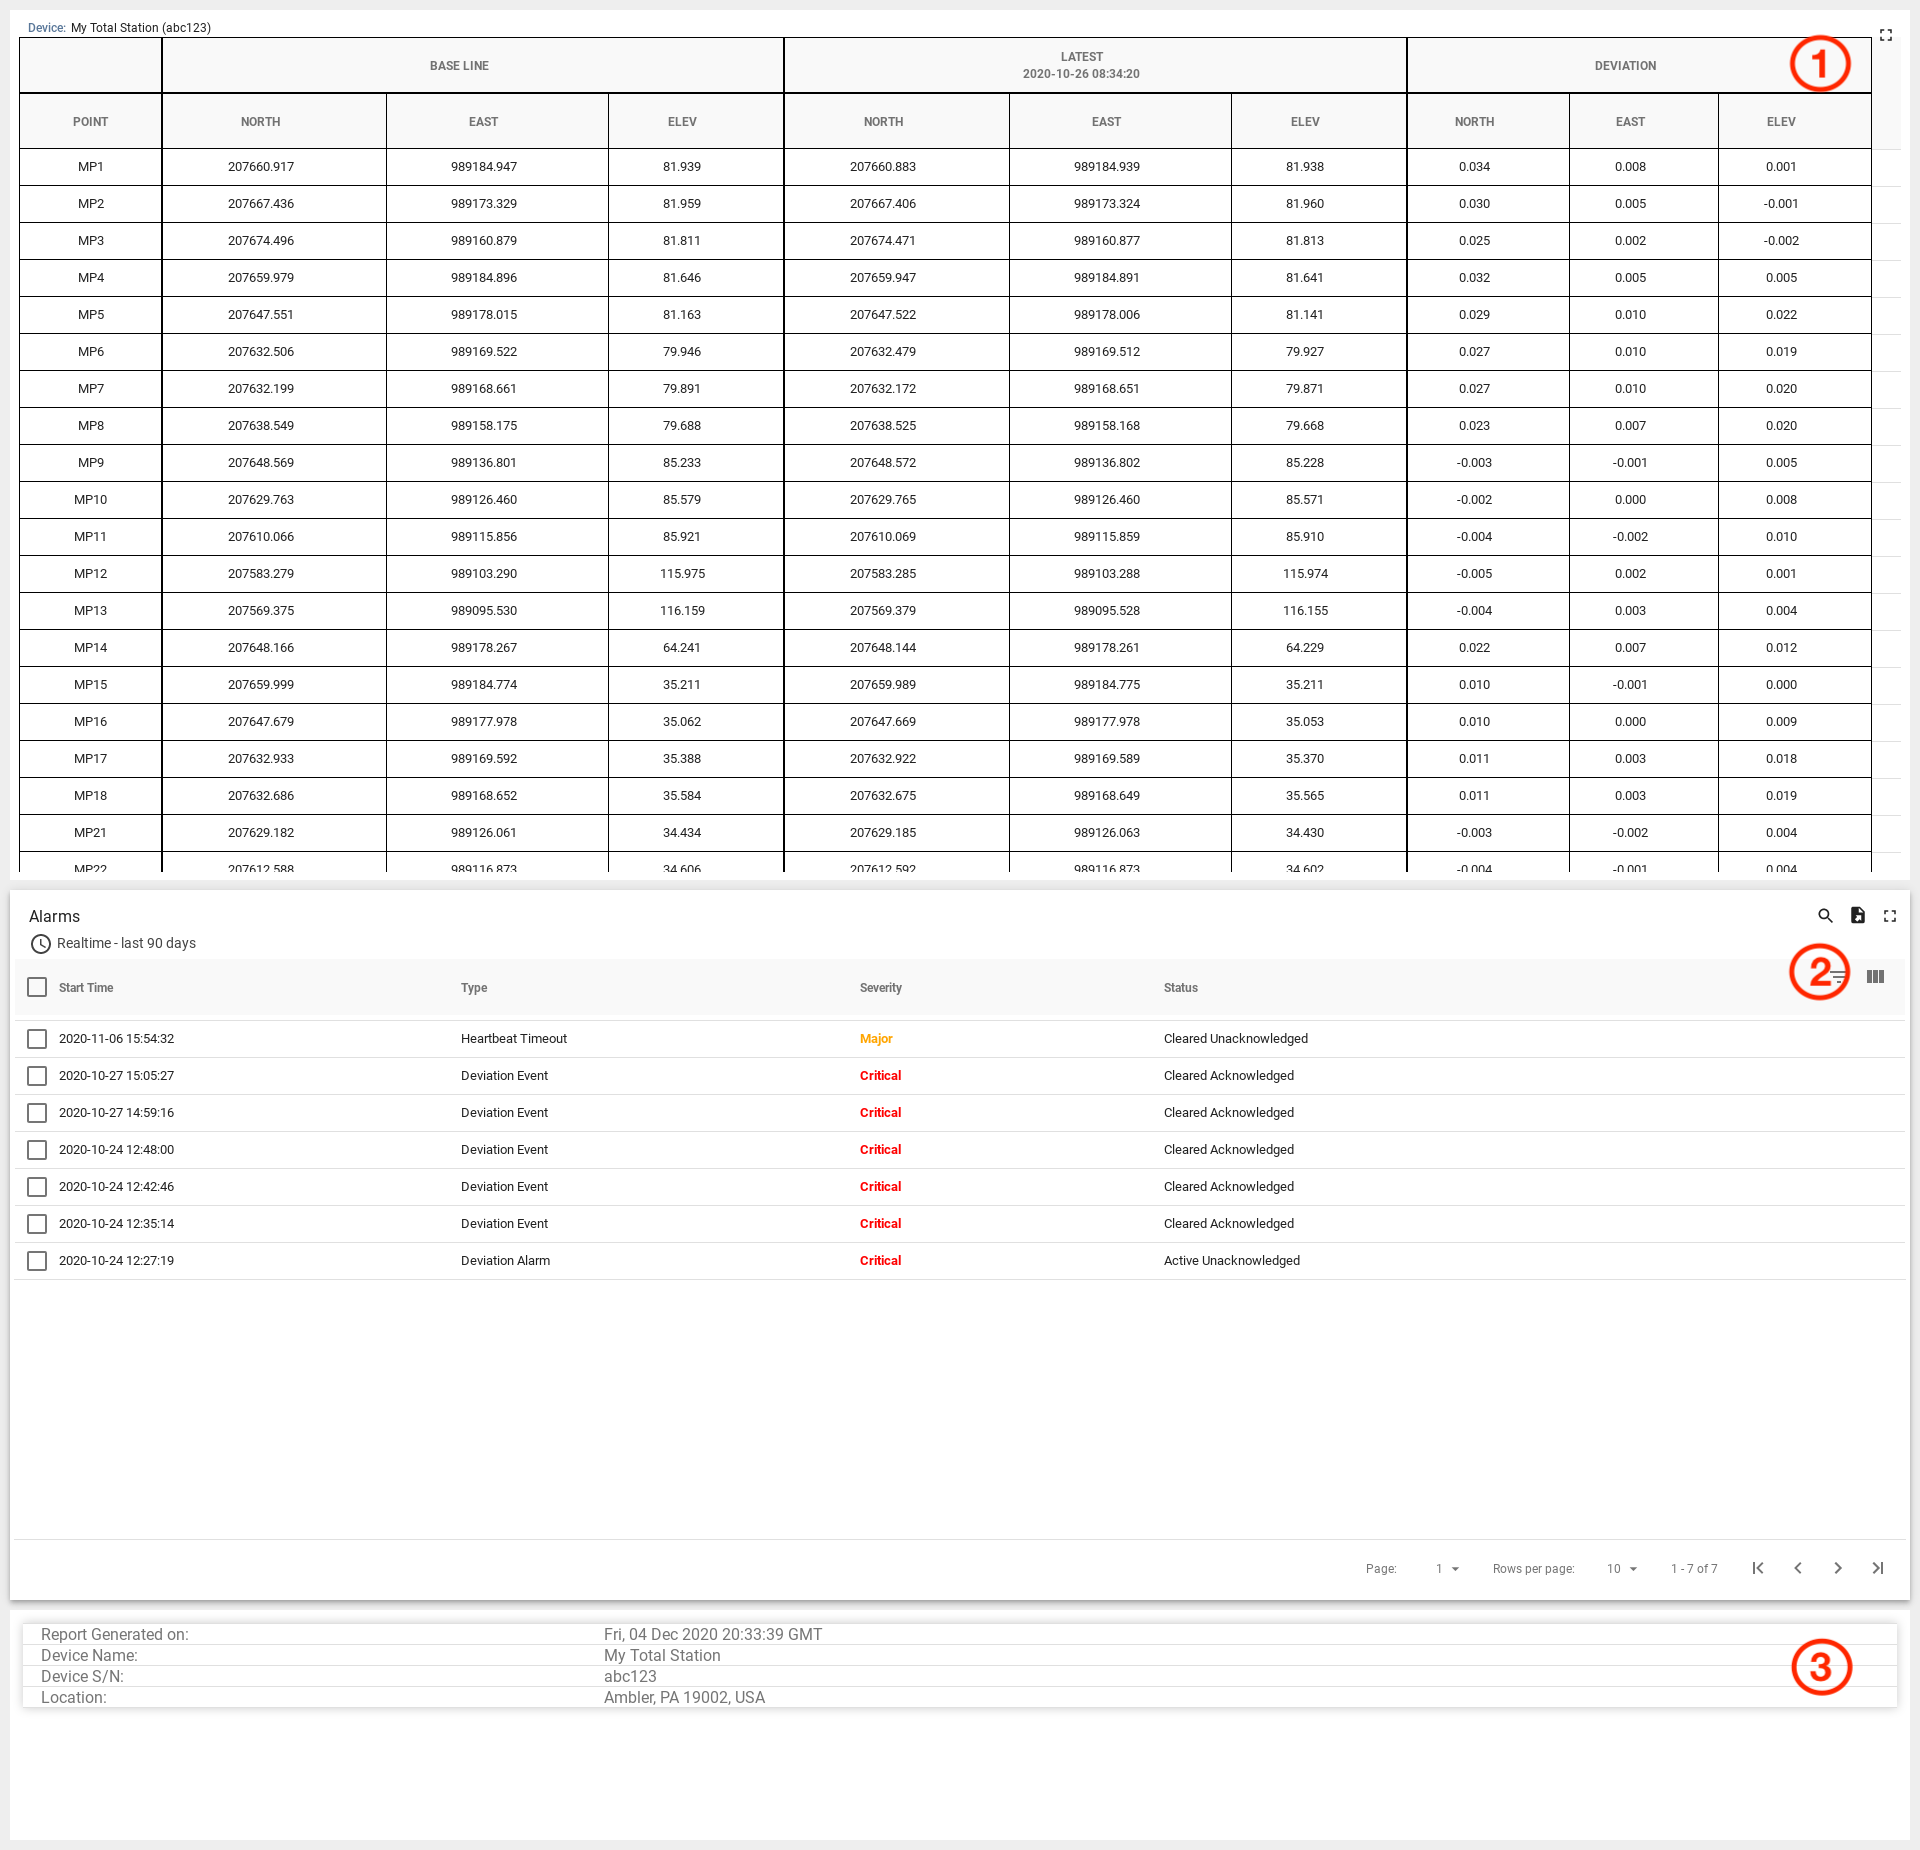
The total station dashboard displays the following informaiton:
- Marker Data - Displays north, east and elevation values for marker data collected by the total station.
- Alarms - Historical list of alarms occurring on this device.
- Report Footer - Includes device serial number, label, location (if configured), and date the dashboard was generated.
Alarm Reports
Alarm reports present data collected during an alarm condition and are available for devices that change their data collection behavior when an alarm occurs.
Vibration & Noise Alarm Reports
Vibration Alarm Report
(applies to Inzwa Veva 3, Instantel® Micromate® & Minimate®, and Syscom® MR3000) 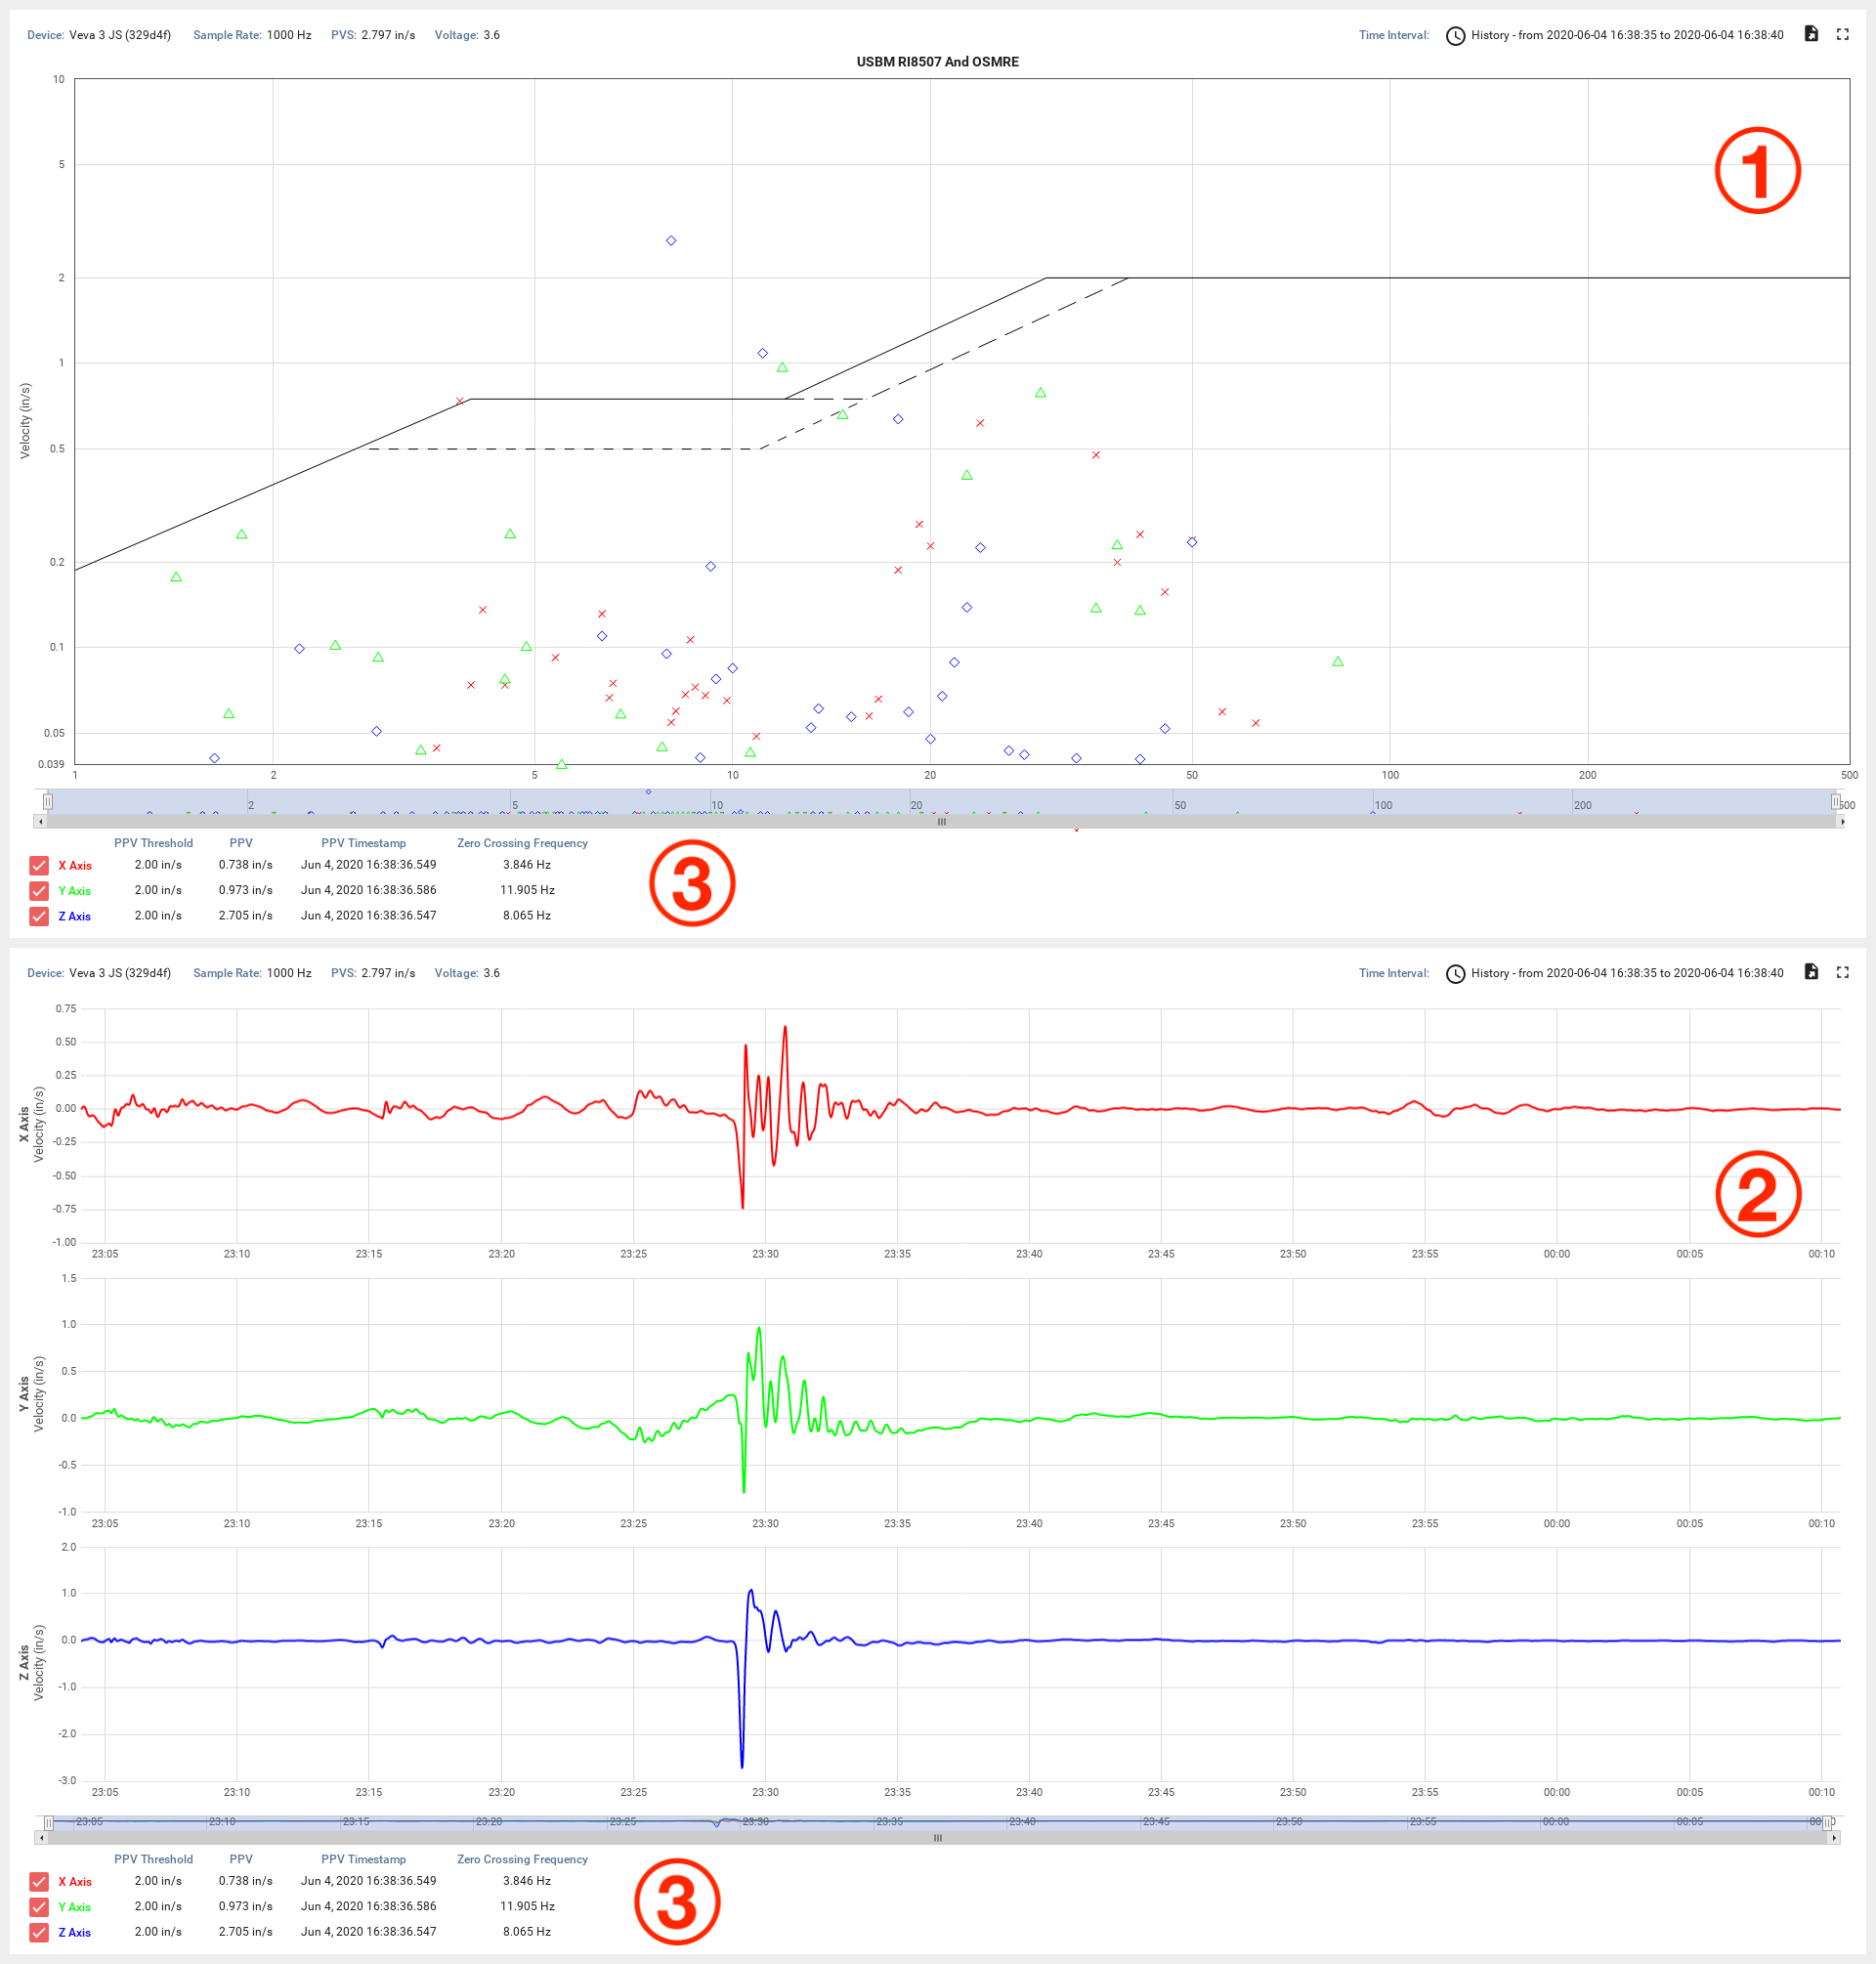
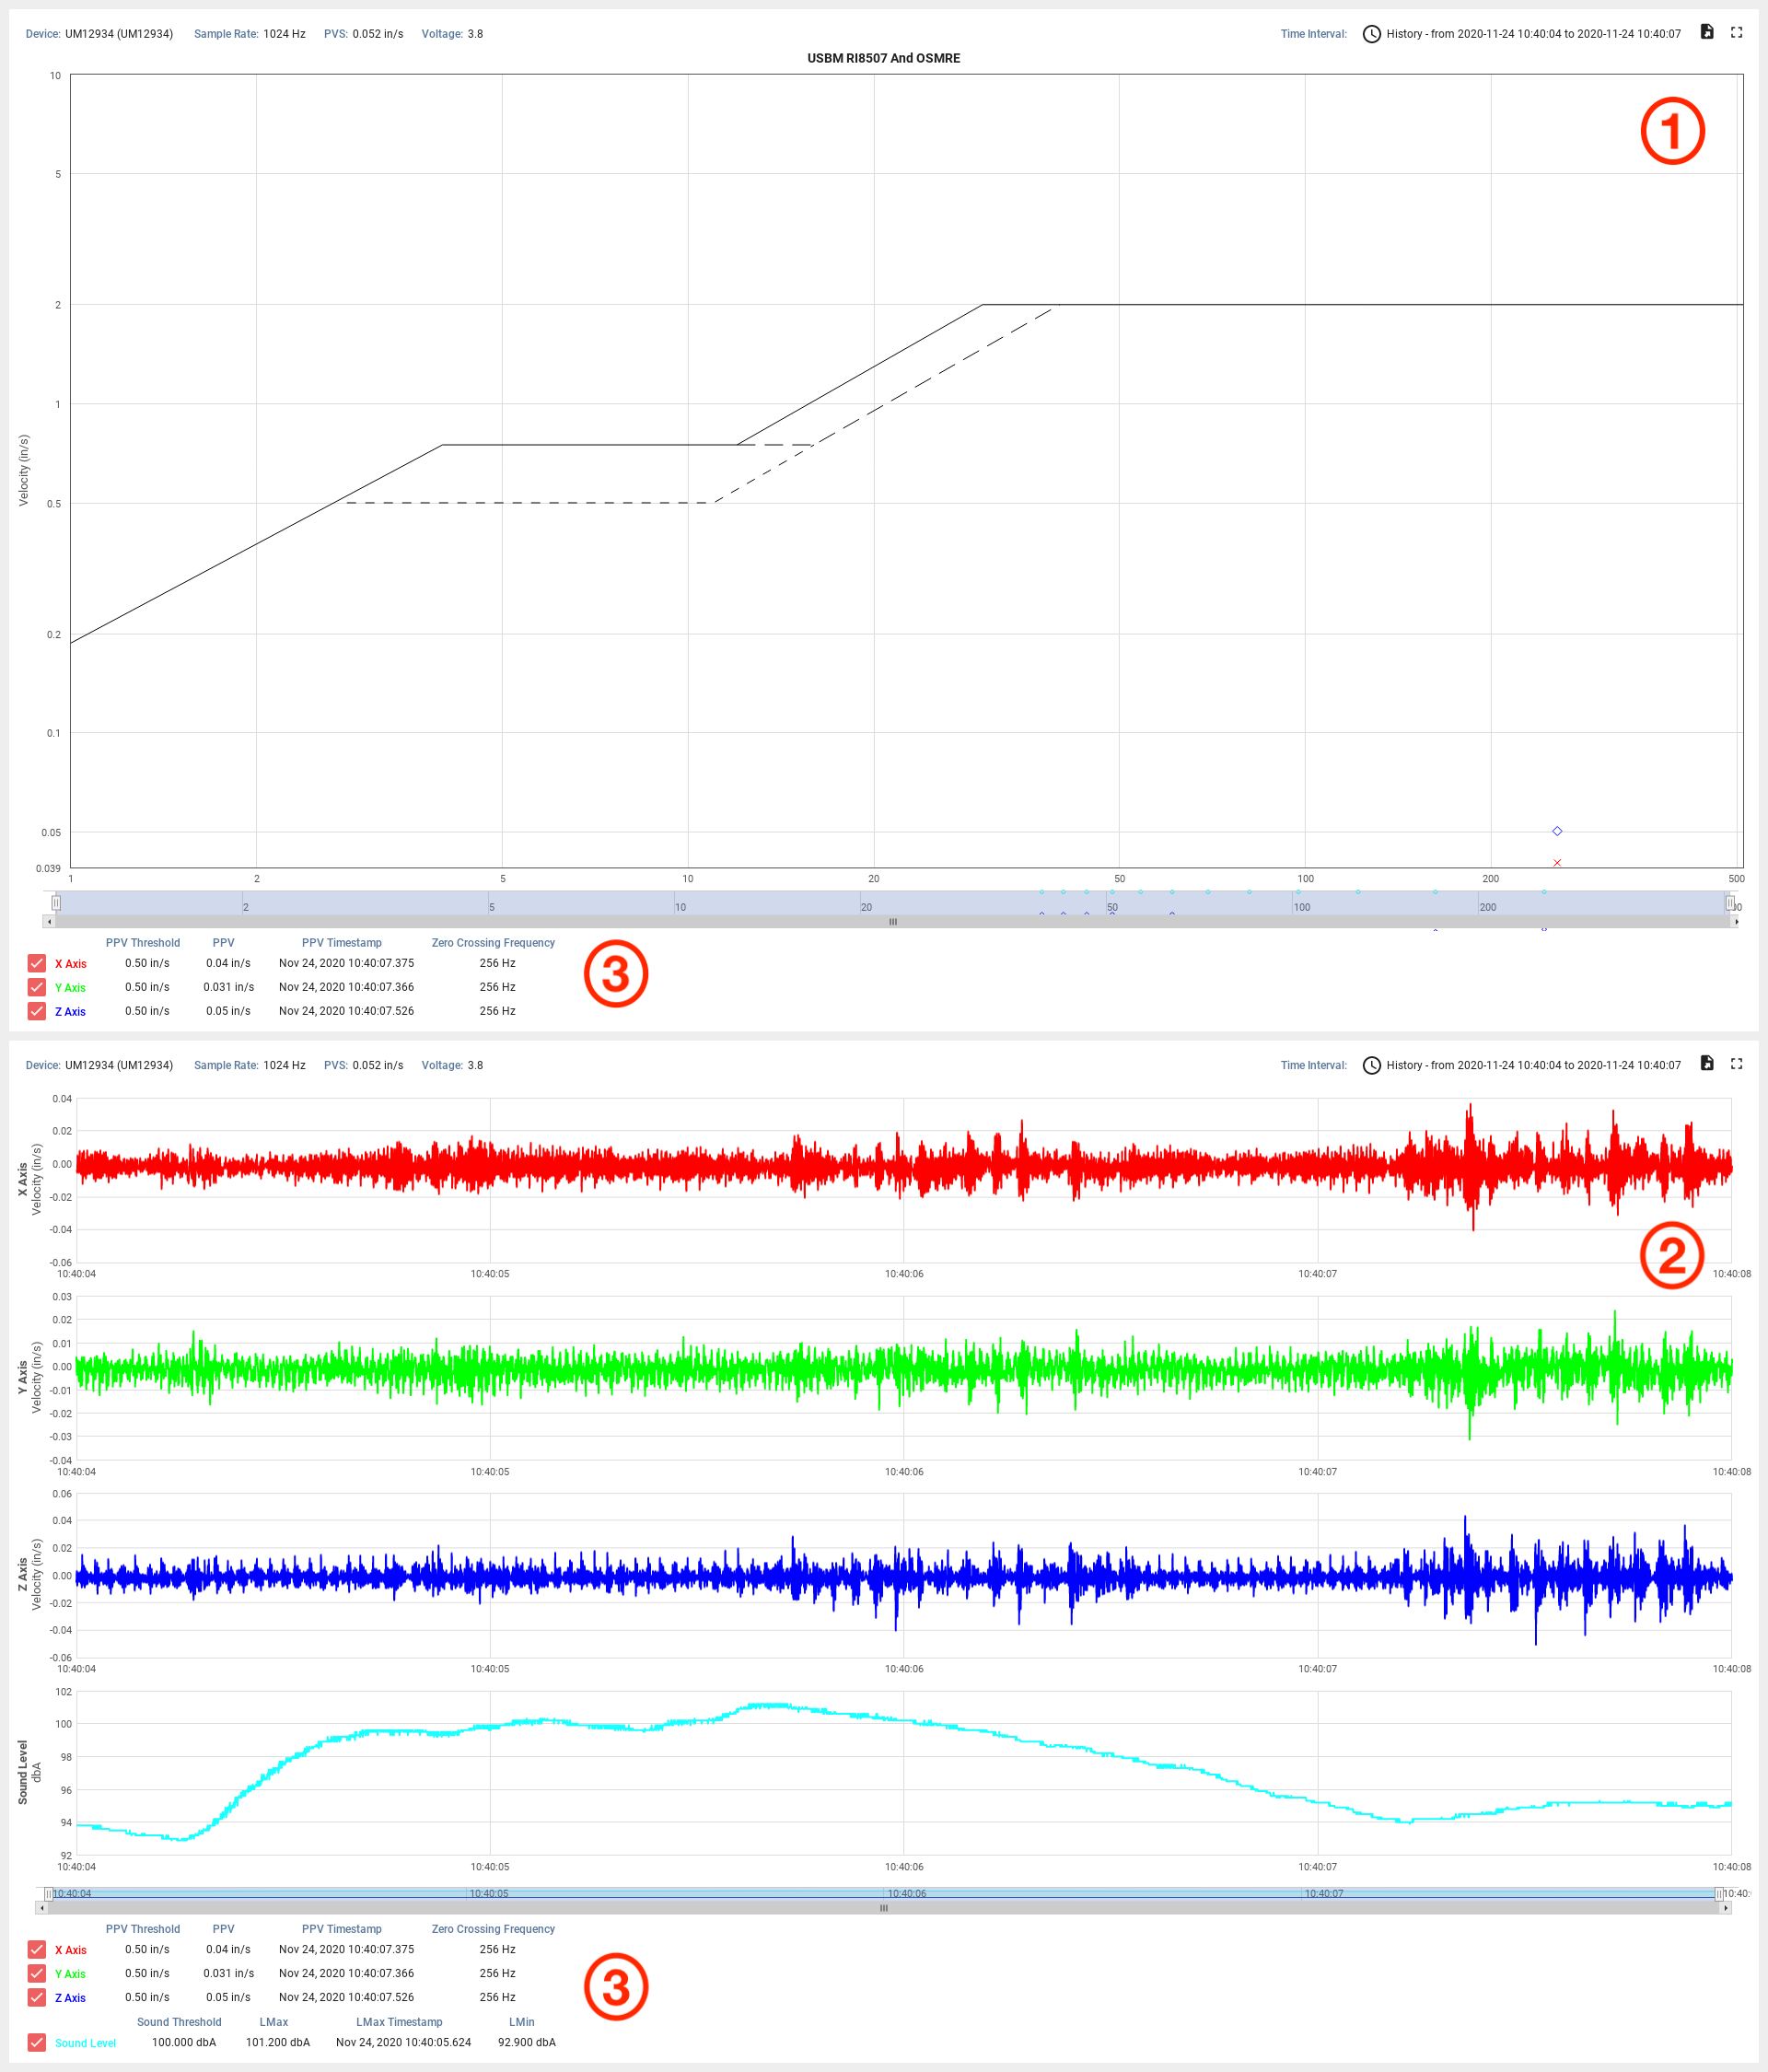
- Frequency Response Chart - The frequency response chart displays amplitude data at discrete frequencies observed in the alarm waveform data. Use the slider control under the chart to zoom and pan for a more detailed view of the data. By default, the frequency response data is charted on a USBM R18057 and OSMRE chart using the zero crossing method. Fast Fourier Transform (FFT) presentation is available as are other vibration standards. Contact Inzwa for more information.
- Waveform Chart - The waveform chart displays amplitude data over time during the course of an alarm event. Each axis displays on a separate chart. Use the slider control under the chart to zoom and pan for a more detailed view of the data.
- Alarm Event Stats - Displays the alarm thresold, peak particle velocity (PPV), PPV timestamp and zero crossing frequency for each axis. Use the checkbox to toggle the display of each axis on or off. If noise data was collected, sound level minimum, maximum and maximum timestamp are shown.
